Historical Coastal Damages: Impact of Climate Change on Coastal Flooding in London
Info: 15180 words (61 pages) Dissertation
Published: 11th Dec 2019

Investigating Historical Coastal Damages
The Impact of Climate Change on Coastal Flooding in London
Cover Artwork
The Great Wave off Kanagawa, Hokusai
The print series by Hokusai shows a ‘plunging breaker’ wave off the coast of the Japanese town of Kanagawa. The work, arguably one of Japan’s most famous, is testament to the overwhelming power of the sea.
Image source: The British Museum, Hokusai – Beyond the Great Wave
Available at: http://www.britishmuseum.org/whats_on/exhibitions/hokusai.aspx
Table of Contents
2.3 Coastal Water Level Variations
2.5 Return Periods of Water Levels
3.3 Prediction of Storm Surges
3.4 The 1953 East Coast Surge – Case Study
3.5 The 1990 North Wales Surge – Case Study
3.6 The 2013/14 UK Surges – Case Study
4.0 Comparison of the 1953 and the 2013 Storm Surges
5.0 Global Implications of Climate Change
5.2 More Extreme Weather Events
5.3 Potential Implications of Rising Sea Level Globally
6.0 UK Implications of Climate Change
6.1 UK Sea Level Rise Scenarios
6.2 Potential Implications of Rising Sea Levels to the UK
6.3 Significance of UK Coastal Zone
6.4 Adaption to Sea Level Rise in the UK
7.1 Shoreline Management Plans
7.2 Flood Forecasting and Warnings
7.3 Policy Management for Sea Level Rise Scenarios
9.0 Issues Facing the Thames Estuary
9.1 Closures of the Thames Barrier
9.2 Thames Estuary Flood Management Issues
10.0 Thames Estuary Flood Risk Management
Figure 2.1.1: Map showing Proportion of Population Living within 100km of the Coast
Figure 3.4.1: The Distribution of Storm-induced Water Level at the time of Maximum Surge
Figure 3.4.2: Number of Properties Flooded Around the UK as a Result of the 1953 Storm
Figure 3.4.3: A Breach in the Defences in the southwest Netherlands, 1953
Figure 3.6.1: Time Series of Significant Wave Height (Hs), Cornwall
Figure 3.6.2: Waves crashing against the Damaged Track at Dawlish
Figure 4.1.1: 12-hourly Wind and Pressure in the 1953 and 2013 Events
Figure 6.1.1: Estimated UK Absolute Sea Level Rise Time Series for the 21st Century
Figure 7.1.2: Map highlighting Flood Risk areas, Erosion Spots and Protected Coasts
Figure 7.1.1: SMP Sediment Cells
Figure 8.0.1: Location Map of the River Thames, showing the Tidal Limit at Teddington
Figure 8.3.1: The Four Positions of the Revolving Rising Sector Gate
Figure 8.3.2: The Thames Barrier Closed to Prevent Flooding Upstream, 2012
Figure 9.1.1: Thames Barrier Closures per Year between 1982 and 2010
Figure 10.2.1: Possible Modification of the Thames Barrier
Table 3.1.1: Estimated Events of some Historical Storm Surge Events
Table 4.3.1: Comparison of Impacts caused by the 1953 storm and the 2013/14 storms
Table 5.1.1: Processes Contributing to Global Se Level Rise (1993-2006)
Table 6.1.1: Estimate of UK Mean Sea Level Change over the 21st Century
Table 6.2.1: Existing Exposure to Tidal Flooding and Coastal Erosion
Table 6.3.1: Socio-Economic Significance of the Coastal Zone in the UK
Table 7.3.1: Policy Management for different Sea Level Rise Scenarios
Table 8.0.1: Assets and People at Risk in the Tidal Thames Floodplain
Table 9.1.1: Number of Closures of the Thames Barrier for the past few Decade
Table 9.1.2: Predicted Closures of the Thames Barrier
Table 10.2.1: Non-structural Options for Managing Flood Risk
Growing populations and increasingly expensive infrastructure are making our societies more vulnerable to coastal damages. Coastal damages include coastal flooding, coastal erosion, and damage to both structures and coastal ecosystems. There is evidence of coastal damage dating back to prehistoric times; it is important that past events of coastal damage are understood so that we are able to prepare for, and mitigate against such events happening again in the future. Coastal damages may result in:
- casualties and fatalities,
- damage to property and infrastructure,
- the need for evacuation or temporary accommodation,
- disruption to transport and energy networks, and
- environmental contamination/ damage.
The exposure of coastal populations worldwide to coastal damages has grown as a result of increased concentration of socio-economic activities around coasts during the nineteenth and twentieth centuries. Additionally, sea level rise and the predicted increase in frequency of extreme weather events, such as storm surges, will result in higher risk of damages.
The British coastline, stretching 12,000 km, has a high exposure to coastal damages. Currently one-third of the coastline of England and Wales has some form of shoreline protection, particularly in southern and eastern England where the land meets the North Sea; defences have been continuously upgraded following events of coastal damages. Estimates from the National Appraisal of Assets at Risk (MAFF, 2000) suggest that, in England, a total of 1.1 million properties, 4,000 km2 of land, and capital value worth £137 billion, are currently located in coastal areas at risk of coastal flooding and erosion. The Thames area, containing London, the UK’s main financial centre, accounts for a large percentage of the assets at risk along the British coastline. The Thames Estuary has a particularly high exposure to coastal flooding and has experienced severe storm surges from the North Sea. The exposure of the Thames area to coastal flooding is increasing as a result of climate change, socio-economic change and ageing flood defences.
Aims and Objectives
The aim of this dissertation is to investigate historical coastal damages, focussing specifically on damages incurred by coastal flooding along the coast of the UK. The main focuses of the investigation are:
- to investigate previous events and responses to coastal flooding events affecting the UK, focussing specifically on events in the Thames Estuary region
- to explore the potential implications that climate change, and subsequent rising sea levels and increased extreme weather event frequency, will have on coastal flooding both globally and in UK
- to investigate issues facing the Thames Estuary region as a result of ageing flood defences, socio-economic change and rising sea levels
The key intended outcome of this thesis is to review how disastrous flooding events have helped to shape the management of the UK coastline (focussing specifically on the Thames region) today. To gain an understanding of this, a number of scholarly articles, reports, books and webpages have been reviewed and summarised.
Coastlines, commonly defined as areas within 100km of the land-sea boundary, have always been the primary focus of human settlement. Throughout history, cities were built around coasts because they provided opportunities for trade, jobs, and transportation. Figure 2.1.1 shows the percentage of each country living within 100km of the coast; several coastal cities with a population of more than one million people have been highlighted on this figure. However, there are many more coastal cities with more than this number of inhabitants.
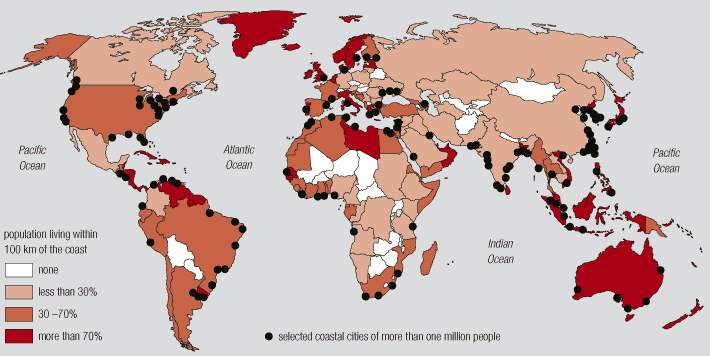
Figure 2.1.1: Map showing Proportion of Population Living within 100km of the Coast
Source: (UNEP, 2005)
Currently 13 of the world’s 20 largest cities are located on the coast (Worldatlas, 2016). With rural to urban migration in many developing countries, and a growing city dwelling population worldwide, the number of people living in coastal areas is on the rise; the UN Human Settlements Programme estimates that by 2030, 60% of the world’s population will live in cities (UN-HABITAT, 2011). The rise in urbanisation and socio-economic development in the coastal zone will increase the assets and number of people at risk along the world’s coastlines.
Stretching over 12,000km (de la Vega-Leinert & Nicholls, 2008), the British coastline is the longest in Europe. The coastline forms an important part of cultural heritage and has huge environmental significance. Currently, one-third of the British coast, and roughly 1.5 million people, are protected by some form of coastal defence (MAFF, 1999). Defences range from simple earth embankments to huge hard engineering structures such as the Thames Barrier. The areas most at risk from coastal flooding are the low-lying areas of southern and eastern England. In total, it is estimated that there is £120 billion worth of infrastructure and resources at risk from coastal flooding (Parliament, 2010).
2.3 Coastal Water Level Variations
Sea level is a measurable quantity, this is constantly fluctuating due to natural processes such as astronomical tides and winds blowing across the sea surface. The daily rise and fall of the tide is caused by the gravitational attractions of both the moon and the sun acting on water particles at the surface of the earth (Dean, 2002). Although new technologies allow us to calculate/ predict sea levels, ‘even the most carefully prepared tidal predictions of sea-level or current variations differ from those actually observed, because of the weather effects’ (Pugh, 1987).
Water levels can be significantly greater than the levels predicted by tidal analysis. Causes for more significant water level fluctuations include storm surges, basin oscillations, tsunamis and climatological effects (Reeve, et al., 2012). The main causes of significant water level variation to affect the UK currently are storm surges, with climatological effects predicted to become a much bigger issue with rising global sea levels. Relative sea level rise is a gradual change in sea level and measured in mm per year whereas more rapidly changing sea levels caused by tides, storm surges are measured in metres per hour.
Globally, 37 percent of natural disasters are accounted for by floods in 1999 and more than 100 million people are at risk of flooding (Oldershaw, 2001). Coastal flooding occurs when land is flooded by sea water; this can result in damage to buildings, infrastructure and agricultural land. Flooding can also cause distress and disturbance to those who are affected by it. The coastal flooding events which affected much of the UK in the winter of 2013/14 were an unwelcome reminder of the devastation that coastal flooding and storm surges can bring to local communities.
2.5 Return Periods of Water Levels
The average period of time between occurrences of a given event is known as the return period. These are used to estimate the likelihood that a given water level will occur in any one year. For example, an extreme event with a 500 year return period is considered to have a 0.2% chance of occurring in any given year. Observations of previous water levels can be extrapolated (using either probabilistic calculations or more recently model simulations) to produce the return period of a given water level. Knowing the return periods of water levels is important in assessing the threat to coastlines and assessing how extreme a certain water level is.
‘Recent serious flooding events such as those experienced by the UK in 1953, and more recently 2013/14 have highlighted the serious hazard posed by coastal flooding’ (Met Office, 2014). The National Risk Assessment (NRA) is an assessment of the risk of civil emergencies facing the UK population, produced by the Cabinet Office every two years. A civil emergency is defined by the Civil Contingencies Act 2004 as ‘an event or situation which threatens serious damage to human welfare in a place in the United Kingdom’, ‘an event or situation which threatens serious damage to the environment of a place in the United Kingdom’ or ‘war, or terrorism, which threatens serious damage to the security of the UK’.
In the NRA, the seriousness of the risk of the emergency is dependent on both the likelihood of the event happening over the following five years, and the impacts that people would feel if the emergency were to happen. Coastal flooding was rated as the second highest risk in the NRA conducted in 2015 (Cabinet Office, 2015). The relative likelihood of coastal flooding, (with an overall impact score rated at four out of a possible five), occurring in the next five years was assessed to be between 1 in 200 and 1 in 20 (Cabinet Office, 2015) meaning that both the likelihood and impact are high. The fact that coastal flooding was rated as the second most serious risk to face the UK in the next five coming years shows how seriously the government considers coastal flooding and also highlights the current need to understand and prepare for coastal flooding.
Coastal defence is the general term used to encompass both coastal protection against erosion and sea defence against flooding. Flood defence structures are earthen or non-earthen structures that prevent low-lying hinterland from being flooded (French, 2001). This is achieved by (i) building a structure of greater height than the expected water level along the coast and (ii) ensuring that the structure is able to withstand all possible loads (French, 2001). Coastal flooding defences include seawalls, beaches and cliffs, dunes, breakwaters, and point structures (e.g. Sluices and outlets). Numerous recent events have shown that flood defences have not always fulfilled their role sufficiently well – defences have been failed or been breached, leading to huge areas being flooded.
Flooding can arise as a result of ‘functional’ failures where water levels exceed those for which the defence has been designed, or structural failure where the defence does not perform as intended (Reeve, et al., 2009). Sea defences in the UK are now designed to necessitate a tolerable amount of overtopping during storms although overtopping of sea walls is still a serious risk (French, 2001); as highlighted in the 2013/14 floods, where overtopping disrupted transport infrastructure and caused structural damage to railway track.
Once a defence has been breached, the volume of water that passes onto the surrounding floodplain can increase by several orders of magnitude (Muir Wood, et al., 2005). High flow velocities immediately behind breaches tend to pose the largest threat and result in the highest concentration of casualties; this was seen in the flood from the 1953 Storm Surge (DEFRA & EA, 2003) for example, of 58 people who died on Canvey Island, 56 were near a significant breach in defences (Baxter, 2005).
The UK’s coastline is exposed to the passage of extra-tropical storms, including the resulting surges, wind and waves (de la Vega-Leinert & Nicholls, 2008). Storm surges are short-lived increases in local water level above that of the predicted tidal level (Lowe, et al., 2009) and are caused by the combination of wind setup/stress and atmospheric pressure upon the surface of the sea (ARM, Climate Research Facility, n.d.). Storm winds can exceed 200km/hour when blowing over large distances (Dean, 2002) and water levels can be particularly large when magnified in enclosed seas (Pugh, 1987). Even small surges can be associated with flooding, particularly when persistent for several tidal cycles (Wells, et al., 2001).
Forces due to wind stress are generated at, and parallel to the sea surface (Pugh, 1987), these transfer energy and momentum to the water. A one millibar change in barometric pressure leads to a one centimetre change in sea level (Met Office, 2014). Low pressure causes depression of the sea surface, while high pressure causes elevation of the surface – this relationship is often described as the inverted barometer effect (Singh, 2006).
Positive surges (elevation at the surface) have the potential to cause flooding, particularly if they occur in tandem with the high tide, winds with a long fetch blow for a long time, and where the surrounding land is low-lying (Singh, 2006).
The equation below expresses the relationship between observed sea level variation in time, X(t), the non-tidal component of sea level, S(t), mean sea level, Z0(t) and the astronomical tide T(t). From this predictions may be made of how the observed sea-level varies with time.
X(t) = S(t) + Z0(t) + T(t) (Pugh, 1987)
‘Storm surges are significant because of their frequency and potential for causing large water level variations in conjunction with large wind waves’ (Reeve, et al., 2012, p. 111). Surges threaten vulnerable human communities and infrastructure on a global scale, and have been described by the Met Office as one of the most dramatic weather events in the UK (Met Office, 2014). The destructiveness of a storm is dependent upon the storm’s magnitude and duration, with storm surges having the potential to cause high water levels which last for several days.
The destructive potential of extreme storm surge events have been well illustrated by historic storms which have dramatically affected coastal areas worldwide. Table 3.1.1 highlights the estimated maximum surge level, and death toll, from past storm surges.
Table 3.1.1: Estimated Events of some Historical Storm Surge Events
| Year | Region | Maximum Surge Level | Lives Lost |
| 1218 | Zuider Zee | – | 100,000 |
| 1864, 1876 | Bangladesh | – | 250,000 |
| 1990 | Texas | 4.5m | 6,000 |
| 1953 | South North Sea | 3.0m | 2,000 |
| 1970 | Bangladesh | 9.0m | 500,000 |
Information contained in table from (Pugh, 1987)
It can be seen from 3.1.1 that many lives have been lost due to storm surges over the past centuries; incredibly, recordings of storm surges date back nearly 800 years. With climate change expected to increase the frequency of severe weather events, keeping detailed records of storm surges and their occurrence will enable us to see what effect climate change has on both the frequency and severity of storm surge events.
3.3 Prediction of Storm Surges
Storm surges are modelled in detail for a variety of reasons; the prediction of the annual maximum return period (eg. a 50- or 100-year storm surge events) allow the design water levels for coastal structures/defences to be determined, whereas real-time modelling of storm surges is used to mitigate hazards and increase public safety (Dean, 2002).
3.4 The 1953 East Coast Surge – Case Study
The most notable case of widespread coastal flooding to affect the UK in the past century was during the weekend of Saturday 31st January to Sunday 1st February 1953, when the east coast of England suffered ‘one of the biggest environmental disasters ever to have occurred in this country’ (Cabinet Office, 2015). A storm surge raged across the northwest European shelf and flooded the low-lying coastal areas of the countries around the North Sea (Gerritsen, 2005).
The North Sea is a marginal sea of the Atlantic Ocean (located between the British Isles and the mainland of north-western Europe) is notorious for storm surges and coastal flooding. Tidal ranges average between 4 and 6 metres along the coasts of Britain and in southern estuaries (Editors, Encyclopedia Britannica, n.d.). In the Netherlands, tidal ranges vary along the coast from 1.4m to 3.8m (Sistermans & Nieuwenhuis, n.d.). The 1953 storm surge coincided with the spring tide high-water and was 3.4 metres above the mean high-water level (Editors, Encyclopedia Britannica, n.d.). This resulted in widespread flooding in both the UK and the Netherlands. Gerritsen states in his report ‘What happened in 1953? The Big Flood in the Netherlands in retrospect’ that the maximum surge occurred at the time of spring-tide high water and as a result of this the overall water level reached heights, ‘that in many locations, exceeded those recorded ever before’ (Gerritsen, 2005). Figure 3.4.1 shows the distribution of storm induced water-level over the southern North Sea at the time of maximum surge.
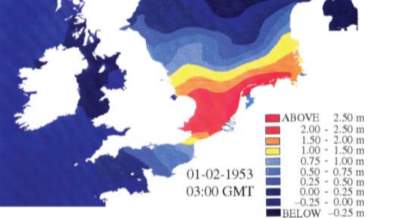
Figure 3.4.1: The Distribution of Storm-induced Water Level at the time of Maximum Surge
Source: (Gerritsen, 2005)
The devastating storm was important in identifying a need to better understanding coastal flooding, leading to the development of storm surge forecasting and the building of improved coastal flood defences across much of Britain and Europe.
Impacts, UK
Over 1,200 flood defences on the east coast were breached by a combination of high tides, storm surge and large waves (Cabinet Office, 2015); the largest breach being around 100m wide (Muir Wood, et al., 2005). Some 300 people were killed (de la Vega-Leinert & Nicholls, 2008), 65,000 hectares of land was flooded and 24,000 homes were damaged (Met Office, 2014). As a result hundreds of people were evacuated. Fortunately flooding did not reach central London but there was considerable flooding further downstream (Lavery & Donovan, 2005). The total material cost of the damages in the UK was estimated at £40-50 million in 1953 (de la Vega-Leinert & Nicholls, 2008) (Cabinet Office, 2015) the equivalent to around £1 billion in 2017.
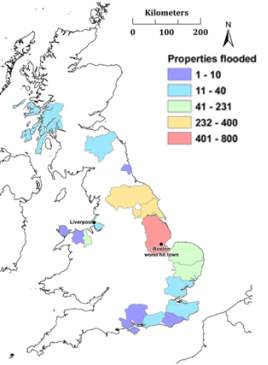
Figure 3.4.2: Number of Properties Flooded Around the UK as a Result of the 1953 Storm
Source: (Wadley, et al., 2015)
Impacts, Netherlands
Damage in the Netherlands was even greater than in the UK; a larger area of land being flooded (over 160,000 hectares) and at least 1,800 lives being lost (Editors, Encyclopedia Britannica, n.d.). The large number of fatalities in the Netherlands and large scale of flooding related to the fact that much of the affected area was below sea level (Gerritsen, 2005). ‘Internal government reports in the late 1930s and early 1940s already noted that the level of protection against sea floods in the Southwest part of the country was a serious concern’ (Batjes & Gerritsen, 2002). Many defences were breached as a result, the largest breach being 520m (Muir Wood, et al., 2005).
At the time of the flood, 750,000 people lived in the areas affected and although a storm tide warning system was in place to warn authorities, these communications were largely ineffective due to the fact that the event took place during the weekend (Gerritsen, 2005). Therefore the people of the Netherlands were unprepared for the surge which breached 150 dykes (Gerritsen, 2005) resulting in huge damages to property, inundated land and loss of life.
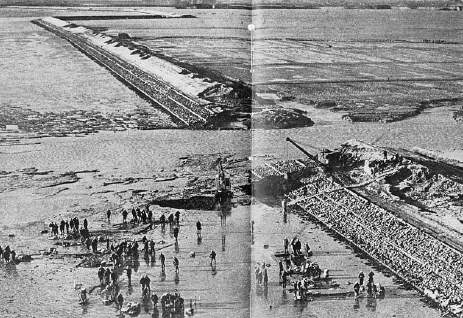
Figure 3.4.3: A Breach in the Defences in the southwest Netherlands, 1953
Source: (Muir Wood, et al., 2005)
Responses, UK
Following the storm surge, the UK government appointed a departmental committee (The Waverly Committee) to examine the danger of future floods and make recommendations (Gilbert & Horner, 1984). ‘At the time, little was known about the natural phenomenon which caused surge tides and how these might interact with a normal spring tide to produce very high water levels in the North Sea’ (Gerritsen, 2005). The committee recommended that further research should be done to improve understanding of surge tides and suggested that an improved warning system should be established (Gilbert & Horner, 1984). In response, the UK Storm Tide Warning Service (STWS) was set up in the early 1980s. The STWS was responsible for predicting and issuing warnings of impeding high water levels and situations likely to cause coastal flooding to regional and local authorities. In 1996, the role of issuing flood warnings to the general public was taken over by the Environment agency (EA) and as of April 2009, the STWS is now named the ‘UK Coastal Monitoring and Forecasting’ (UKCFM) service to better reflect the service carried out (Met Office, 2016).
The flood was the catalyst for the improved coastal defences along much of the UK coast, including the Thames Barrier structure (which and can be closed if flooding from the North Sea threatens the city of London), 70 miles of banks along the estuary were strengthened, costing £300 million (Gerritsen, 2005) and five minor barriers and two substantial flood gates were constructed (Gerritsen, 2005). Hundreds of thousands of properties and around 2000km2 of agricultural land and now protected across the UK (Sibley, et al., 2015).
Due to the investments made in coastal flooding defences, and flood monitoring and warning systems following the storm surge, the likelihood of an event causing such severe damage to the UK is now significantly lower.
Responses, Netherlands
Following the 1953 storm, flood protection became a national priority in the Netherlands (Batjes & Gerritsen, 2002) with 30% of the country below sea level (Sistermans & Nieuwenhuis, n.d.), it was important that measures were put in place to mitigate against such a disaster happening again. The Dutch government formed the Delta Committee, similar to the Waverly Committee, whose purpose was to investigate whether or not the flood defences along the Dutch coast were sufficient, and to establish what measures should be taken in order to protect the country (d’Angremond, 2003). The committee suggested that the defences protecting the most densely populated areas should be able to withstand flooding with a return period of 10,000 years (d’Angremond, 2003).
To mitigate flood risks, the Dutch inaugurated the Delta Project – a series of construction projects in the southwest of the Netherlands consisting of dams, storm surge barriers, dykes and sluices (Deltawerken, 2004). The project, sometimes referred to as the eighth wonder of the world, reduced the need of 700km of coastal defence levees (Deltawerken, 2004) and protects the country from flooding from the North Sea.
3.5 The 1990 North Wales Surge – Case Study
Towyn is a town situated on the coast of North Wales; the town was been built on large areas of coastal lowland which was reclaimed during the 18th century (Bates, 2005). On 26th February 1990, coastal flooding occurred when 467m of seawall was breached (Bates, 2005) affecting four square miles from Pensarn to Kinmel Bay (Met Office, 2010).
A combination of low atmospheric pressure and westerly storm force winds lead to a 1.5m storm surge (Bates 2005) which, similar to the 1953 surge, coincided with spring tides (Met Office, 2010), resulted in the breaching of existing tidal defences and extensive coastal flooding in the region. The flood was able to reach 2km inland, with a maximum depth of 1.8m (HR Wallingford, 2003 cited in Bates et al., 2005, p.800) due to the low-lying coastal floodplain topography. The flooding lasted several days and a large proportion of the houses affected were flooded to a depth of 2m by water contaminated by sewage (Riley & Meadows, 1995).
Impacts
Approximately 2,800 properties were inundated (Hurst, 1997) and around 6,000 people had to be evacuated (Dawson, et al., 2011); 5,000 of whom had to live in temporary accommodation until it was safe to return to their homes (Met Office, 2010) (Williams, 2010). Repairs to the damaged houses were believed to have cost between £22.4 million and £100.8 million (Zong & Tooley, 2003). Fortunately, there were no fatalities but the anxiety of the flood is believed to have led to the premature death of about fifty people (Welsh Consumer Council, 1992 – cited in Wales Audit Office, 2009).
Responses
In response to the flooding, a rock revetment was built, limiting the possibility of defences being breached again (Williams, 2010). As a result of the damage, improvements have been made to sea defences elsewhere along the welsh coast, including new sea defences built in south Gwynedd which opened in 2010 at a cost of £7.6m; these will protect about 75 homes (BBC, 2011).
3.6 The 2013/14 UK Surges – Case Study
Although previous surges (particularly the 1953 surge) have resulted in improved coastal defences nationally, the continued threat of serious coastal flooding around the UK was apparent during the winter of 2013 – 2014. From late October 2013 to February 2014, the UK experienced a series of severe winter storms, caused by a powerful jet stream driving a succession of low pressure systems across the Atlantic Ocean (Wallace, et al., 2014).
Figure 3.6.1 shows significant wave height (HS) measured at Sevenstones Lightship at the southwest tip of Cornwall from the 1st October 2013 to the 1st May 2014. In total 22 storms occurred over this period, represented on Figure 3.6.1 by red circles; the size of each circle representing the storm duration (Masselink, et al., 2015).
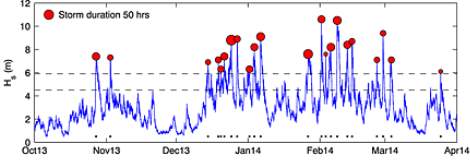
Figure 3.6.1: Time Series of Significant Wave Height (Hs), Cornwall
Source: (Masselink, et al., 2015)
High wind speeds were recorded across the UK in early December, and the highest still water levels on record were produced at several tide gauges along the east coast (Spencer, et al., 2015). On the 5th – 6th December, these high water levels culminated in a North Sea storm surge event, which coincided with one of the highest tides of the year (Met Office, 2014). The surge threatened much of the east coast, as the 1953 surge had. The largest tide was recorded at Southend since the Thames Barrier became operational (Met Office, 2014). Flooding and erosion occurred all along the North Sea coast, parts of Newcastle’s quayside were submerged as the Tyne Estuary overflowed whilst further south in Whitby, 200 seafront properties were flooded (Sibley, et al., 2015).
During January and early February, storms fell at a low latitude bringing strong winds along the south and west coasts of the UK, pushing waves with exceptionally long wave periods, and lots of energy, towards the southwest (Met Office, 2014). Areas in Wales, Devon and Cornwall experienced the highest waves in 30 years (Cabinet Office, 2015).
Impacts
The storms resulted in widespread flooding throughout the UK and tested national sea defences. Localised breaching and overtopping of defence structures occurred along with failure in more highly-engineered coastal defences (Spencer, et al., 2015). As a result of storm force winds, four lives were lost in the UK (Spencer, et al., 2015). Hundreds of trees fell across the UK, disrupting transport links and causing travel delays (BBC, 2014).
During December, severe coastal flooding occurred on the west coast of North Wales as well as in North West England and the west coast of Scotland (Spencer, et al., 2015). The North Sea tidal surge lead to 2,800 homes being flooded and consequently thousands of people having to be evacuated (Cabinet Office, 2015). Earthen barriers were breached across the country with land flooded behind breached barriers in Suffolk amounting to 660 hectares (Spencer, et al., 2015).
In January, coastal flooding occurred and the high energy waves were able to inflict significant damage on coastal infrastructure (Met Office, 2014); perhaps the most notable damage was to a section of sea wall and 100m stretch of railway track which was destroyed in the coastal town of Dawlish, Devon. The strong high tides breached the sea walls protecting the railway at several locations along the coast of Devon; in one location near Dawlish Station, the sea wall was breached completely, placing pressure at the foundations resulting in the washing away of the track. At Teignmouth, slightly south of Dawlish, 25,000 tonnes of cliff face had sheared above the railway line (BBC, 2014).
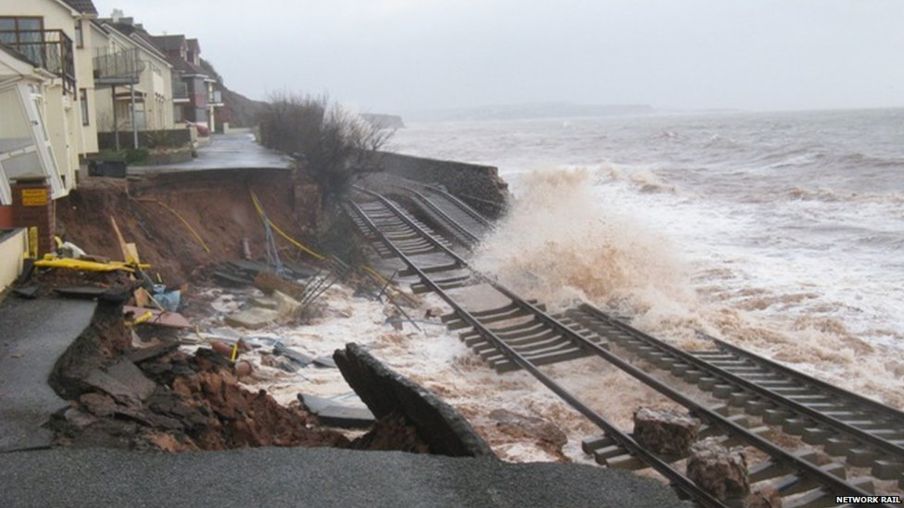
Figure 3.6.2: Waves crashing against the Damaged Track at Dawlish
Source: (BBC, 2013)
Responses
The Thames Barrier was raised to protect London from the December surge (Met Office, 2014). In January 2014, more than 30 flood warnings were in place across the UK, and around 160 flood alerts (BBC, 2014). The railway line at Dawlish was repaired at a cost of £35 million, sea walls were repaired and the collapsed cliff material was removed from Teignmouth (BBC, 2014). 7km of defences were prepared on the South Humber bank which had been damaged by the December tidal surge (Environment Agency, 2014).
The storms of 2013/14 generated a surge event of similar magnitude to that of 1953, it is therefore easy to make comparisons between the two events and to ascertain why much less damage was caused by the later storm event and resulting surge. The following three factors have been considered:
- The meteorological conditions
- The observed high sea levels observed during both events
- The coastal flooding and impacts
Both the 1953 and 2013 storms developed off the coast of Greenland and then approached northeast Scotland along a similar track. However, the 1953 storm then tracked southwards into the Netherlands, whereas the 2013 storm continued along a more eastward path into Scandinavia (Wadley, et al., 2015), as shown in Figure 4.1.1. Similar maximum wind speeds were recorded at weather stations in Scotland during both events, with both storms generating significant peak wind speeds.
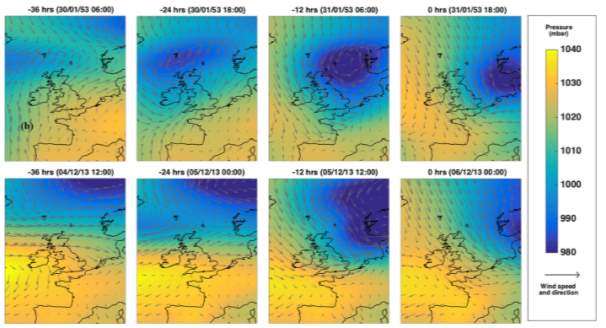
Figure 4.1.1: 12-hourly Wind and Pressure in the 1953 and 2013 Events
Source: (Wadley, et al., 2015)
However, the passage of the 1953 storm track from Ireland across into Europe and was considerably slower than that of the 2013 storm, taking approximately double the time to travel the same longitudinal distance. The development of the 2013 surge was therefore much faster than that of the 1953 surge (Sibley, et al., 2015).
In the 1953 event, wind speeds blowing over the southern North Sea basin were both more intense and more sustained, resulting in greater maximum wave heights and also increased likelihood of the coincidence of storm conditions with high tide (Wadley, et al., 2015).
The main key difference between the two storms is that the high waters produced on the northeast and south coasts were smaller in 1953 than 2013 (Wadley, et al., 2015). There is a significant lack of data for the 1953 surge in some areas around the UK, however it can be inferred from the fact that there were no reports of flooding in Wales and North West England during this storm, that more extreme high waters were produced in these areas by the 2013 storm.
High waters from Suffolk to Kent were, in the most part, larger during the 1953 storm; some similar levels between events being recorded in some areas of Suffolk (Wadley, et al., 2015). High waters, in places among the Thames region, were more than half a metre above those produced in 2013; for example in Sheerness, 4.90m levels were produced in 1953 compared to 4.10m in 2013. The recorded high water at the mouth of the Thames Estuary on 6 December 2013, although not as high as that recorded of 1953, was the highest since the Thames Barrier was completed in 1982 (Reeder, 2013). The Thames Barrier was closed for two days, preventing the surge from propagating beyond Greenwich – this produced a 2m difference in water height between the front and back of the barrier (The Actuary, 2013).
The surge component of both events was exceptionally large; the largest observed in 1953 being a 3.9m surge in Harlingen, the Netherlands (Wolf & Flather, 2005) and 3.4m in 2013 in areas of the North Sea (Mills, et al., 2013).
The more southerly track of the 1953 storm amplified the surge resulting in higher high waters in southern areas of the UK and North Sea. The 2013 event coincided with a period of higher astronomical tide; the 6 December morning high tide was nearly half a metre higher than the equivalent February 1953 tide (Wadley, et al., 2015).
While the flooding that occurred following the December 2013/14 storms was extensive, the impacts were substantially less than those experienced in the 1953 event. The 2013/14 event saw no flood related deaths and considerably less land flooded.
Table 4.3.1 compares the impacts resulting from the two storm events.
Table 4.3.1: Comparison of Impacts Caused by the 1953 Storm and the 2013/14 Storms
| 1953 Storm | 2013/14 Storms | |
| Fatalities |
|
|
| Land |
|
|
| Property |
|
|
| Evacuations |
|
|
| Total Cost |
|
|
Information contained in table cited in table if not previously stated in text
The events of the December 2013 events correlate reasonably well with those of 1953, with a low pressure centre (of similar magnitudes) moving from Iceland to the north of Scotland in both storms. The direction of the low pressure centre following this resulted in the varying magnitudes of measured sea level, with higher sea levels measured during the 1953 surge. It is however hard to compare the data in all locations due to the lack of tide gauges (and high quality sea level recordings) from 1953.
Both of the storm surge events have demonstrated how significant coastal flooding events can devastate major urban centres. It is obvious from comparing the data that the 1953 storm event had a much greater impact than the events of 2013/14; this is unsurprising considering the improvements made to coastal defences and accurate early warning systems put in place following the devastation of 1953. Although the disastrous surge of 1953 was predicted by the Met Office, public warning systems were ineffective resulting in a lack of preparedness and damages of a much greater scale. The Flood Forecasting Centre and the EA issued early warnings of the 2013 event, meaning that people were prepared for the incoming coastal flooding. It is promising to see that coastal flooding can be mitigated against and that investments in both flood defences and forecasting meant that a human catastrophe of similar scale to that of the 1953 event was averted.
Today, there is clear evidence to show that climate change is happening; Measurements show that the average temperature at the Earth’s surface has risen by about 0.8°C over the last century (GOV.UK, 2014). The average temperature in Britain is now 1˚C higher than it was 100 years ago and 0.5˚C higher than it was in the 1970s (GOV.UK, 2014). Along with warming at the Earth’s surface, many other changes in the climate are occurring, including the warming of oceans, melting polar ice and glaciers, rising sea levels and more extreme weather events.
Global mean sea level is rising as a result of rising global temperatures. Although there is great uncertainty surrounding predictions of sea level rise, it has been suggested that extreme sea levels in the 2080s could be 1.2 m higher than current extremes (Lavery & Donovan, 2005) (Hulme, et al., 2002). Ocean thermal expansion and glacier melt have been the dominant contributors to twentieth century global mean sea level rise (Bennett, et al., 2016).
Regional sea level changes may differ substantially from the global average however, about 70% of the global coastlines are projected to experience a relative sea level rise within 20% of the global mean sea level rise (Bennett, et al., 2016). ‘Shifting surface winds, the expansion of warming ocean water, and the addition of melting ice can alter ocean currents which, in turn, lead to changes in sea level that vary from place to place’ (Bennett, et al., 2016).
Warming Oceans
While the temperature rise at the Earth’s surface may get the most headlines, the temperature of the oceans has been increasing too. This warming has been measured all the way down to 2 km deep (GOV.UK, 2014). The warming of oceans causes thermal expansion increasing the volume of water and thus the overall sea level.
Melting Polar Ice and Glaciers
As the seas warms, sea ice is decreasing rapidly. Over the past 20 years the ice sheets (the great masses of land ice at the poles) in Greenland and the Antarctic have shrunk, as have most glaciers around the world (GOV.UK, 2014). The contribution of both the Greenland and Antarctic ice sheets has increased since the early 1990s as a result of the warming of the immediately adjacent ocean (Bennett, et al., 2016). The melting of the Greenland ice-sheet could contribute a global sea level rise between 3 and 6 meters for the next 1,000 years (Hulme, et al., 2002). In the period 1961-2003 it has recently been estimated1 that 40% of sea level rise was caused by the expansion of water as it was heated by global warming and 60% from shrinking glaciers, ice caps and ice sheets (Parliament, 2010) Table 5.1.1 shows the contribution of different processes to global sea-level rise annually.
As land ice melts and the warming oceans expand, sea levels have risen. Since 1900, global average sea level has risen by 20cm (Parliment, n.d.), likely faster than at any point in the last 2,000 years. Global average sea level continues to rise at the rate of roughly 3mm per year (Parliment, n.d.). A study from The Institute for New Economic Thinking at the Oxford Martin School, shows that warming of 2°C will lead to a global average sea-level rise of 20cm; warming of 2°C would occur by the year 2040 under a business-as-usual scenario (Oxford Martin School, 2016). The rise in global average surface temperature is a result of increasing greenhouse gas emissions. Some scenarios suggest that in around 120 years, 25 major coastal cities (including London and New York) could be submerged (Parliment, n.d.).
Table 5.1.1: Processes Contributing to Global Sea Level Rise (1993-2010)
| Process | Contribution to Global Sea-Level Rise (mm/year)
|
| Ocean thermal expansion | 1.1 (0.8 to 1.4) |
| Melting of glaciers and ice caps | 0.86 (0.46 to 1.26) |
| Melting of the Greenland ice sheet | 0.33 (0.25 to 0.41) |
| Melting of the west Antarctic ice sheet | 0.27(0.16 to 0.38) |
| Land water storage | 0.38 (0.26 to 0.49) |
| Total of contributors | 2.8 (2.3 to 3.4) |
Information contained in table from (Church, et al., 2013)
5.2 More Extreme Weather Events
Climate change can lead to changes in the likelihood of the occurrence or strength of extreme weather events (Bennett, et al., 2016). This has resulted in more damaging extreme weather events are being seen around the world. Heat waves have become more frequent and are lasting longer (GOV.UK, 2014). The height of extreme sea levels caused by storms has increased. Warming is expected to cause more intense, heavy rainfall events. In North America and Europe, where long-term rainfall measurements exist, this change has already been observed (GOV.UK, 2014).
Rising temperatures (which result in storms carrying more rain) and sea level changes associated with climate change are likely to increase the severity of weather events (GOV.UK, 2014). It is possible that gale frequencies will increase in northern Europe, including the UK, due to climate change (Hulme, et al., 2002).
The relationship between sea-level rise and storminess is complex. The modelling of storm induced surges versus climate change scenarios is still at the research phase (Lowe & Gregory, 2005). However, even with no change in storminess, the rise in global mean sea-level will result in a reduction of the return period of extreme high waters (Church, et al., 2001).
5.3 Potential Implications of Rising Sea Level Globally
With global mean sea levels projected to increase over the next century, problems of coastal flooding and erosion will be exacerbated around the world. As previously mentioned, the rise in mean sea level will reduce the return period of extreme high waters (Church, et al., 2001), meaning that the frequency of extreme events is likely to increase. The rise in urbanisation and socio-economic development in the coastal zone will also increase the risk of coastal flooding, with 400 million people projected to be living in coastal megacities by 2030 (Oxford Martin School, 2016).
Ground water extraction for the purpose of building on land previously unoccupied will increase the effect of land subsistence and worsen the risk of coastal flooding. Research suggest that without restrictions on the extraction of groundwater, parts of cities including Bangkok will sink below sea level (Oxford Martin School, 2016).
6.1 UK Sea Level Rise Scenarios
A study conducted by the DEFRA and the EA has estimated that the British coast is affected by a sea level rise of between 0.9 and 1.2mm per year (without considering eustatic change) (Defra and EA, 2007). Table 6.1.1 shows the predicted UK mean sea level change over the 21st century. Values of rise are given for three different emissions scenarios (high, medium and low) for the period 1980-1999 to 2090-2099.
Table 6.1.1: Estimate of UK Mean Sea Level Change over the 21st Century
| Emission Scenario | Central Estimate of Mean Sea Level Change (cm) |
| High Emission | 45.6 |
| Medium Emission | 36.9 |
| Low Emission | 29.8 |
Information contained in table from (Lowe, et al., 2009)
Figure 6.1.1 shows the absolute sea level rise predictions for the 21st century. The central estimates for each of the three emissions scenarios have been plotted in red, these are shown together with the range in rise given by the 5th and 95th percentiles in black.
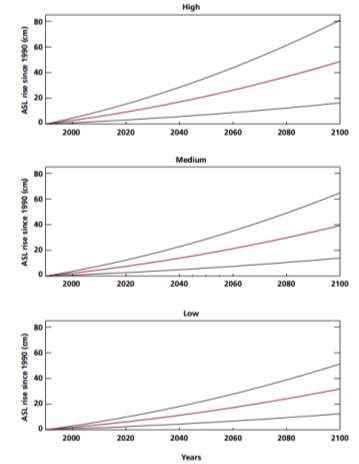
Figure 6.1.1: Estimated UK Absolute Sea Level Rise Time Series for the 21st Century
Source: (Lowe, et al., 2009)
6.2 Potential Implications of Rising Sea Levels to the UK
Large parts of the UK’s coast already experience a number of issues, including erosion, degradation of local coastal ecosystems and considerable exposure to coastal flooding (de la Vega-Leinert & Nicholls, 2008). Rising sea levels will result in higher storm surges and the decrease in the level of protection offered by current flood, exposing more of the UK to potential flooding.
The associated risks to the UK from rising sea level are high and are likely to have a severe impact on UK coasts by 2080 (Zsamboky, et al., 2011). Most at risk from coastal flooding and erosion are the low lying areas of eastern and southern England (Parliament, 2010) where softer, less resistive coastal types, such as beaches and salt marshes are prominent (de la Vega-Leinert & Nicholls, 2008). Additionally, large areas of coast have been claimed over the past centuries and are now also susceptible to flooding should existing coastal defences fail (de la Vega-Leinert & Nicholls, 2008). Estimated economic losses to coastal flooding are an order of magnitude larger than erosion losses (de la Vega-Leinert & Nicholls, 2008).
Table 6.2.1 highlights the existing exposure to coastal flooding and coastal erosion in England and Wales. Given the high exposure of the Thames region to sea/tidal flooding, this information has also been included.
Table 6.2.1: Existing Exposure to Tidal Flooding and Coastal Erosion
| England and Wales
|
Thames Area | |||
| Coastal Flooding | Coastal Erosion | Total
|
Coastal Flooding | |
| No. of Properties at Risk (x1000) | 1046 | 76 | 1122 | 434 |
| Agricultural Land at Risk (x1000 ha) | 402 | 4 | 406 | <2 |
| Capital Value at Risk £billion | 130 | 7 | 137 | 81 |
Information contained in table from (de la Vega-Leinert & Nicholls, 2008)
The threat of sea level rise and its associated impacts will be felt by communities all over the UK which rely on the immediate coastal area for residence, infrastructure and economic activity.
6.3 Significance of UK Coastal Zone
The UK’s coastal zone has huge socio-economic significance, elements of the UK which will be affected as a result of accelerated rising sea levels are highlighted in Table 6.3.1. As well as the factors mentioned in the TABLE 6.3.1, coastal areas in the UK have huge cultural significance, critical ecological significance at both national and European level and a large tourism industry.
It is estimated that, in total, there is £120 billion worth of infrastructure and resources at risk from coastal flooding and a further £10 billion at risk from coastal erosion (Parliament, 2010). Storm surges and flooding associated with climate change are also likely to affect vital public infrastructure such as health and emergency services and public transport along the coast (Zsamboky, et al., 2011).
Table 6.3.1: Socio-Economic Significance of the Coastal Zone in the UK
| Population |
| 47% (28 million) of the UK population lives in coastal urban agglomerations. |
| 30% (17 million) of the population of England and Wales lives within 10 km of the coast. |
| 2.5 million people live in coastal areas below 5 m OD (approximately mean sea level) in England and Wales, including one million in London; this exposure appears to be increasing (e.g., London docklands regeneration). |
| Most Scottish and Northern Irish urban centres are located along the coast. |
| Industry |
| 40% of England and Wales’ manufacturing industry is located in the coastal zone. |
| Total annual turnover of the British marine industry estimated at £11 billion. |
| Total annual turnover of all UK industries in the coastal zone: £51 billion (4.8% GDP). |
| Agriculture |
| 57% grade 1 agricultural land (i.e., arable land) in England and Wales is located below 5 m OD (particularly around the Wash, and in Norfolk, Suffolk, and north Kent). |
| Extensive cattle and sheep grazing on marginal coastal pasture. |
| Water |
| 35 public supply abstraction points in England and Wales located close to the tidal limit could be threatened by salinisation given accelerated sea level rise. |
| Energy |
| UK’s oil industry infrastructure (including pipelines and refineries) are concentrated on the east coast of Scotland (e.g., Moray Firth) and England. |
| 70% of fossil-fuel generating capacity is located on the coast. |
| Most nuclear plants are located on the coast. |
| Transport and Communication |
| Critical transport infrastructure is located on the coast (e.g., all ports/harbours, strategic roads, and rail links, Channel tunnel). |
| Finance |
| The key component of this sector (i.e., the City and Canary Wharf) is located on the tidal reaches of the river Thames. |
Information contained in table from(de la Vega-Leinert & Nicholls, 2008)
6.4 Adaption to Sea Level Rise in the UK
The level of protection offered by current flood defences will decrease with sea level rise, resulting in an increase in areas susceptible to potential flooding. It is, therefore, important to understand the rate of sea-level rise and prepare effective adaption strategies (Parliament, 2010).
UK preparations for adaption to sea level rise are more advanced than in most European coastal countries (de la Vega-Leinert & Nicholls, 2008). In preparation for rising sea levels, adaptive approaches to coastal flood risk management are being studied (Parliament, 2010). It is recommended that an allowance for sea-level rise are included in the design of new coastal defences in the UK (de la Vega-Leinert & Nicholls, 2008). Concern about flooding has resulted in vulnerability assessments to be carried out, which has led to adaption for sea-level rise becoming an important aspect of long-term sustainable coastal management; for example the Thames 2100 Project which will be discussed in more detail later.
It is estimated that £120 billion worth of infrastructure and resources at risk from coastal flooding across the UK (Parliment, 2010). All UK coastal urban areas are at risk of flooding, however some areas are more susceptible than others and therefore management strategies vary along the coastline. In England and Wales, the central government plays an important role in setting framework for flood and coastal defence (Rogers, 2010). In England the Department for Environment, Food and Rural Affairs (DEFRA) has overall responsibility for flood (and coastal) risk management policy. DEFRA provide funding for the Environment Agency (EA), who are responsible for maintaining, operating and improving flood defences (Rogers, 2010).
7.1 Shoreline Management Plans
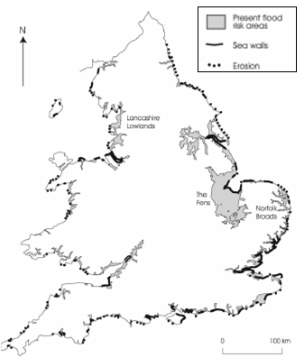 The planning of new coastal defence schemes in the UK is now carried out within strategic shoreline management plans (SMPs); these describe how a stretch of coast is most likely to be managed in order to protect against flooding and/or erosion (EA, 2015). An SMP is a ‘high level, non-statutory policy document that provides a large-scale assessment of the risk associated with coastal processes’ (SOPAC, 2016) and takes into account the risks presented by climate change. SMPs divide the 6,000 mile coastline of England and Wales into 11 primary coastal cells, with a series of sub cells within the primary cells; these are illustrated in Figure 7.1.1. In 1994, the Government encouraged Coastal Groups (made up of local authorities working with the EA) to implement SMPs, with the aim of providing a more strategic and sustainable approach to coastal defence (SOPAC, 2016). SMPs engage with the interest of organisations and local communities (EA, 2015) and the chosen policy must be ‘technically feasible, environmentally acceptable and economically sustainable’ (SOPAC, 2016).
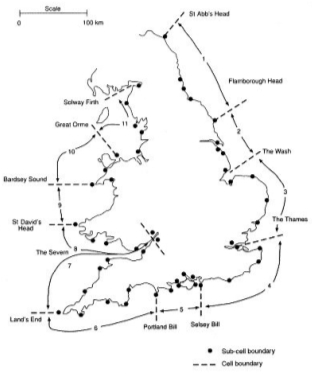
Figure 7.1.2: Map highlighting Flood Risk areas, Erosion Spots and Protected Coasts
Source: (de la Vega-Leinert & Nicholls, 2008)
Figure 7.1.1: SMP Sediment Cells
Source: (SOPAC, 2016)
SMPs identify one of four management policies (EA, 2015) for sections of coastline within a sub-cell; the chosen policy is largely dependent upon the level of development/ investment which is being protected. The four policy types are listed below:
Holding the Line – An aspiration to build or maintain artificial defences so that the position of the shoreline remains.
Managed Realignment – Allowing the shoreline to move naturally, but managing the process to direct it in certain areas.
No Active Intervention (do nothing) – There is no planned investment in defending against flooding or erosion, whether or not an artificial defence has existed previously.
Advance the Line – New defences are built on the seaward side.
7.2 Flood Forecasting and Warnings
The Environment Agency is in charge of forecasting floods and issuing warnings (Enironment Agency, 2009). There are currently two primary flood warning services in the UK; Floodline Warnings Direct, which communicates flood risk to the public via telephone, SMS messages, email or pager (Cabinet Office, 2012), and a 24-hour telephone service called Floodline providing up-to-date information regarding current and predicted flooding (GOV.UK, 2017). The number of tide level and wave gauges around the UK are rising to improve the quality of coastal flooding forecasting (Enironment Agency, 2009); this will enable areas to be more prepared for flooding, thus reducing the impact of flooding events.
7.3 Policy Management for Sea Level Rise Scenarios
Managing the ever increasing risk of coastal flooding has been recognised in Britain as a critical issue since the 1990s (de la Vega-Leinert & Nicholls, 2008). Therefore, coastal management has encompassed climate change and the associated rise in sea levels as one of the key long term issues that must be addressed (de la Vega-Leinert & Nicholls, 2008). As previously discussed, the exact scope of sea-level rise is as yet uncertain. However, depending on the desired lifespan of a project, management is geared to one of three sea-level rise scenarios; low being 20cm/century, median being 60cm/century and high being 85cm/century with a 10% increase in wind. Table 7.3.1 highlights the scenario assigned to projects of various design periods.
Table 7.3.1: Policy Management for different Sea Level Rise Scenarios
| ‘Low’ Scenario: 20cm/century |
| This scenario is applied to take decisions regarding projects with a short design period (approximately five years), requiring limited investments and flexible solutions, such as sand replenishment. |
| ‘Median’ Scenario: 60cm/century |
| This scenario is applied to take decisions regarding projects with a longer period (50-100 years), requiring major investments and little flexibility, such as the construction of dikes and storm surge barriers. |
| ‘High’ Scenario: 85cm/century and a 10% increase in wind |
| This scenario is applied to make spatial reservations for the purpose of flood defence. |
Information contained in table from (de Vries, 2002)
Of the estimated 1.5 million people currently protected by coastal defences in England and Wales, almost one million of whom are located along the Thames Estuary in London (MAFF, 1999).
The exposure of the UK to coastal flooding and storm damage has grown with increasing urbanisation and socio-economic development in the coastal zone. Although all UK coastal urban areas are at risk of flooding, there are some cities more susceptible than others. London, the UK’s largest city and main finance area, which lies on the Thames Estuary, has a high exposure to flooding.
The Thames Estuary is the meeting place of the freshwater River Thames and the North Sea and has a daily rise and fall of water levels of 7m (Environment Agency, 2012). The tidal portion of the River Thames covers a distance of 104km (BGS, n.d.), and extends from Teddington Locks in the east, to where it meets the North Sea at Shoeburyness in the west. The Thames experiences two high tides and two low tides per day (Environment Agency, 2010). Figure 8.0.1 shows the Thames Estuary.
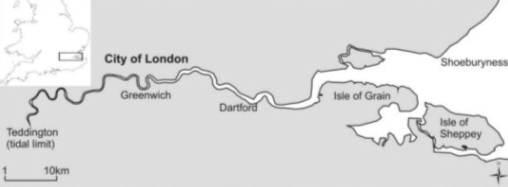
Figure 8.0.1: Location Map of the River Thames, showing the Tidal Limit at Teddington
Source: (BGS, n.d.)
The estuary is susceptible to rises in water levels caused by North Sea storm surges. A surge tide entering the estuary can increase water levels by between 1 and 3 m (Environment Agency, 2012). Storm surges can result in flood threat, particularly if the surge coincides with the ‘spring’ tide as was seen in the 1953 flood. Although the primary threat from flooding is from a North Sea surge, high fluvial flows in the River Thames catchments and wind generated surge components from the English Channel can also cause high water levels, exacerbating tidal flood conditions (Lavery & Donovan, 2005).
The earliest record of flooding along the estuary is from the Anglo Saxon Chronicle of 1099 (Lavery & Donovan, 2005). Countless floods have since been recorded and records of high water level show occurrences of what are considered exceptionally high water levels becoming more frequent. Central London was last flooded by a storm surge in January 1928 when a 1.5m surge propagated up the Thames, resulting in the death of 14 people (Environment Agency, 2010). The total worth of property at risk within the tidal floodplain of the Thames is estimated to be around £80 billion – a significant proportion of the total flood risk properties in England and Wales (Lavery & Donovan, 2005). Other assets and people at risk from coastal flooding in the Thames area are highlighted in Table 8.0.1.
Table 8.0.1: Assets and People at Risk in the Tidal Thames Floodplain
| Assets and People at Risk in the Tidal Thames Floodplain |
| 350km2 land area |
| 1.25 million residents |
| >500,000 homes |
| 8 power stations |
| 167km of railway |
| 51 rail stations |
| 35 tube stations |
| >300km of roads |
Information contained in table from (Environment Agency, 2012)
Managing flooding on the Thames estuary is no new feat, for 1,500 years there have been flood defences protecting settlements built on the floodplain of the River Thames (Environment Agency, 2012). In response to previous occurrences of flooding, the tidal flood-plain of the river is protected by coastal flooding defences; historically, these defences have been improved as a reaction to tidal flooding disasters (for example following the 1953 floods). Progressively sophisticated flood defence systems have allowed the city of London to avoid cases of significant tidal flooding and to continue to thrive despite the continuous threat from the North Sea.
Currently, the tidal flood defence system of the Thames is made up of the Thames Barrier and eight other major flood barriers, 36 industrial flood gates, some 400 smaller moveable structures and over 330 km of walls and embankments (Environment Agency, 2012).
Potential flood conditions are monitored from the control room at the Thames Barrier, this control room is manned for 24 hours a day all year round (Lavery & Donovan, 2005). Forecasts of tide levels in the Thames Estuary are deduced by running data, which is provided every 12 hours, from the Meteorological Office through a series of ‘hind cast’ models (Lavery & Donovan, 2005).
The Thames Barrier is a land-mark civil engineering project installed following the devastating floods of 1953. It was designed to prevent tidal surges from propagating up river of the structure, thus protecting the low-lying areas of central London from flooding.
Concept
The government appointed committee (The Waverly Committee) decided, following the 1953 storm surge, that the best solution to protect London against future flooding was a new type of surge barrier structure across the river (Gilbert & Horner, 1984). There were several possibilities of barrier including a lift barrier, a swing barrier and retractable barrier however, the chosen design was the revolving rising sector gate (Editors, Thames.me.uk, n.d.). The committee recommended that ‘maximum standard of protection to be afforded by public authorities against flooding should in general be that sufficient to withstand the flood of January 1953’ (Gerritsen, 2005), implying that committee believed that no future event would exceed the magnitude of that of 1953. However, the technical panel, whose task was to research storm surges, recognised the need for a higher standard of protection, appreciating that future surge levels could have the potential to exceed those of 1953. The barrier was, therefore, designed to protect the city of London from a 1 in 1,000 year flood event in the year 2030 (including half a metre allowance for increasing surge levels) (Gilbert & Horner, 1984). This height was decided by extrapolating historic observations of high water levels from 1792 to 1953 (Gilbert & Horner, 1984).
Design
The structure comprises of four 61m rising sector gates and six side gates (Burt & Rees, 2001). During normal conditions, the gates remain open but can be closed when a surge tide is predicted (Burt & Rees, 2001). Figure 8.3.1 shows how the sector gate is able to rotate positions, preventing high water levels from travelling upstream; low water spring tide (LWST) and high water spring tide (HWST) are represented on the diagram. Down river from the barrier, flood defence levels were raised and strengthened to accommodate the design surge-tide and reflected wave (Burt & Rees, 2001).
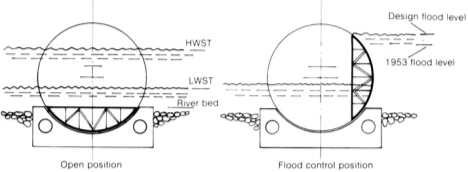
Figure 8.3.1: The Four Positions of the Revolving Rising Sector Gate
Source: (Editors, Thames.me.uk, n.d.)
After almost 30 years of planning, the Thames Barrier became operational in 1982 and was first closed to protect London from flooding on 1st February 1983, coincidentally on the 30th anniversary of the 1953 flood. The overall defences include the barrier, 350 km of flood walls and embankments, smaller barriers, pumping stations and flood gates (Gilbert & Horner, 1984). These defences protect the 1.25 million people who live and/or work on the tidal floodplain and a total of £200 billion worth of property (Environment Agency, 2015). The Environment Agency own and operate the structure. The barrier is shown in the closed position in Figure 8.3.2.
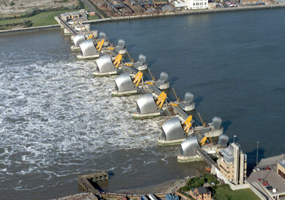
Figure 8.3.2: The Thames Barrier Closed to Prevent Flooding Upstream, 2012
Source: (Parikiaki, 2012)
The overall defence system in place along the Thames Estuary has yet to be tested by a major surge tide, therefore there is uncertainty about how the defence system will perform (Sayers, 2012). The Estuary is also facing increasing challenges brought about by socio-economic change, ageing flood defences and climate change. More importantly, channel constriction in the Thames has dramatically increased tidal and surge heights (Bowen, 1972).
Socio-Economic Change
Socio-economic change has resulted in the extensive development of the Thames Estuary floodplain, increasing the number of assets and people affected by a potential flood. Much of the flood management infrastructure in place was constructed 30 years ago and is gradually deteriorating (EA, 2015). Due to increasing assets at risk along the Thames Estuary and east coast in general, it is estimated that a flood of similar magnitude to that of 1953 would now cause £10 billion worth of damage (Muir Wood, et al., 2005) compared to the £1 billion worth of damage caused in 1953.
Ageing Flood Defence Systems
Much of the flood management infrastructure in place was constructed 30 years ago and is gradually deteriorating, in some cases defences are over 100 years old (Environment Agency, 2015). Flood defence systems, which will come to the end of their serviceable life between 2030 and 2060, will require major repair or replacement likely to cost several billion pounds (Environment Agency, 2012). The vast majority of the current flood defences will come to the end of their design lives at a similar time (Lavery & Donovan, 2005); this presents a key issue in the strategic planning of replacement of defences. In the 2030s, the Thames Barrier will be 50 years old and although the structure itself has been found to be safe up until 2070 (Environment Agency, 2012) (see section 11.0), the operating infrastructure (such as seals and hydraulic systems) will need to be replaced with more up-to-date equipment to ensure the successful continued operation of the barrier (Lavery & Donovan, 2005).
Climate Change
As previously discussed, climate change presents a great challenge in terms of future uncertainty. Accelerated sea level rise will result in an increase in the likelihood of flooding of the Thames area. The UK Climate Projections project, by central estimates, a sea level rise of 18 cm by 2040 and 36 cm by 2080 in London including the land movement (Defra, 2009). Additionally, The latest climate change scenarios suggest that current extreme se-levels in the Thames Estuary could occur between ten and twenty times more frequently than they do currently, with water levels becoming progressively extreme (Lavery & Donovan, 2005).
9.1 Closures of the Thames Barrier
The forecasting of flooding events in the Thames Estuary is managed by the control room at the Thames Barrier with the Meteorological Office providing hint cast models to forecast the tide levels of the Thames every 12 hours (Lavery & Donovan, 2005).
It was anticipated, at the design stage, that the barrier would close to protect London against North Sea surges with increasing frequency as sea-levels rose (Lavery & Donovan, 2005). Figure 9.1.1 shows the number of barrier closures per year between 1982 and 2010. Since the first flood defence closure in 1983, the Thames Barrier has been closed to prevent flooding on over 100 occasions (The National Archives, 2010).
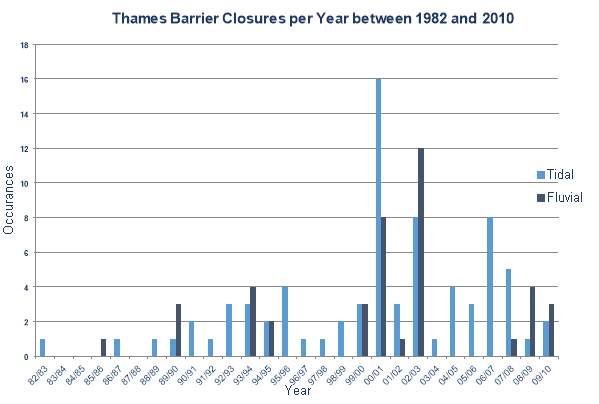
Figure 9.1.1: Thames Barrier Closures per Year between 1982 and 2010
Source: (The National Archives, 2010)
In recent years, the barrier has been closed a lot more frequently. Table 9.1.1 highlights increased closure rates over the past decades.
Table 9.1.1: Number of Closures of the Thames Barrier for the past few Decade
| Decade | Number of Closures |
| 1980s | 4 |
| 1990s | 35 |
| 2000s | 75 |
Information contained in table from (The National Archives, 2010)
The number of closures of the Thames Barrier is a direct indicator of the occurrence of high tides, storm surges and high river flows along the Thames Estuary (The National Archives, 2010). Therefore, the increasing number of Thames Barrier closures per year acts a piece of evidence to suggest that London is, and will continue to be, affected by more frequent high water levels as a result of climate change. The barrier itself requires ongoing maintenance; each closure of the barrier increases not only the risk of a barrier failure but also affects the maintenance regime of the structure. Therefore, considerations should be made for the increased requirement of maintenance for the structure due to the predicted increased frequency of barrier closures.
Future Closures
The Environment Agency have made estimates on the frequency of closures per year over the next century. The forecasting of future closures of the barrier is dependent on two main factors (Editors, Thames.me.uk, n.d.):
- ‘The impacts of climate change on sea and river levels based on climate change scenarios currently available’; and
- ‘The extent to which these levels may be reduced by other flood risk management measures used within the Thames Estuary in conjunction with operation of the Thames Barrier.’
The EA’s studies suggest that the frequency of closures will be as represented in Table 9.1.2.
Table 9.1.2: Predicted Closures of the Thames Barrier
| Decade | Low Estimate | High Estimate |
| 2010 | 10 | 20 |
| 2020 | 20 | 35 |
| 2050 | 6* | 75 |
| 2100 | 30* | 325 |
Information contained in table from (Editors, Thames.me.uk, n.d.)
The low estimate for each year shows the best predicted outcome; this is based on the lowest climate change scenario and the maximum use of flood management mitigation implemented from the year 2030 (shown by *). The high estimate for each year shows the worst predicted outcome; this is based on maximum climate change impacts with no additional flood management mitigation implemented from the year 2030 (Editors, Thames.me.uk, n.d.).
9.2 Thames Estuary Flood Management Issues
The current standard of the Thames Estuary tidal defence is based on calculations made during the design of the Thames Barrier during the 1960s and 1970s (Lavery & Donovan, 2005); as previously stated the defences have been designed to withstand water levels produced by a 1 in 1,000 year flood in the year 2030. Given the drivers for increased flood risk in the Thames Estuary (rising sea levels and socio-economic change), there was a clear need to develop a long term plan for future management of flood risks. Historically, flood management and the implementation of major coastal defence schemes along the Anglican, Southern and Thames region has been haphazard, resulting in 33 separate management plans and strategies (Lavery & Donovan, 2005). There was, therefore, a need for a single, overarching management framework to bring all of the separate plans together coherently; the Thames Estuary 2100 Project aims to do this.
10.1 The Thames Estuary 2100 Project
The Thames Estuary 2100 Project (TE2100), established in 2002 by the EA, aims to develop a strategic flood risk management plan for the Thames Estuary through to the end of the century. The EA’s recommendations for this strategy are set out in the plan which focusses primarily on tidal flooding. The key aims of the project are to:
- consider how tidal flood risk will change in response to climate change and socio-economic change
- understand whether the existing flood defences would need to be raised or replace to deal with rising sea level
The plan covers the tidal Thames region, from Teddington in the west to Shoeburyness/ Sheerness in the east; it sets out how the 1.3 million people and £275 worth of property currently protected from tidal flooding will continue to be protected against tidal flood risk (EA, 2017).
10.2 Findings from the TE2100 Study
The EA conducted a six year study into the tidal flood risk along the estuary to inform the TE2100 Plan. The EA investigated predicted rises in sea level and the existing tidal flood defences. Key findings from the study are listed below (Sayers, 2012):
Predicted Rises in Sea Level
- Tidal defences will need to protect London and the Thames Estuary from both a predicted rise in sea level, and also potentially higher and more frequent storm surges.
- Sea level rise in the Thames Estuary over the 21st Century could be between 20 and 88cm.
- Climate change is less likely than previously thought to increase the height and frequency of storm surges.
- The maximum predicted sea level rise is more than 2.7m by the end of the century. However, this is the worst case scenario and highly unlikely.
Existing Tidal Flood Defences
Another key finding was that existing defence infrastructure continues to provide adequate and robust performance (Sayers, 2012), for example Thames Barrier. The barrier was originally designed to protect against a 1 in 1000 year flood in the year 2030 (with the standard of protection then slowly decreasing over time), however the TE2100 plan discovered that the barrier will in fact provide protection against a 1 in 1000 year flood in the year 2070 (Sayers, 2012). As previously mentioned, many of the defences were built more than 30 years ago – at this time, engineers planned for sea level rise of 8mm/year in the design allowances for the structures. However, the current rate of sea level rise is only 3mm/year (EA, 2017) meaning that the structures have been overdesigned and will therefore be able to provide protection for longer than originally anticipated.
A ‘resistant’ flood management strategy option for the estuary is based on the ‘sweating’ of the current defences (and improving them where necessary); this will ensure that maximum usage is obtained from past investments in the defences. The discovery that the current defences will continue to protect London for longer than originally planned has allowed decisions about major upgrades of the infrastructure to be delayed (Sayers, 2012). It has also allowed an opportunity for non-structural measures to be considered in the strategic planning. Non-structural measures that may be considered are highlighted in Table 10.2.1:
Table 10.2.1: Non-structural Options for Managing Flood Risk
| Flood Forecasting and Warning |
| Improving the lead time and accuracy of the flood-forecasting information used for operation of the Thames Estuary flood management system, and improving flood-warning information for emergency response and damage avoidance. |
| Pre-Event Measures |
| Raising public awareness and improving emergency/multi-agency response planning. |
| Responses Affecting Existing Development |
| For example, retrofitting resilience measures, provision of safe havens and high-level access for evacuation, and secondary defences around critical infrastructure. |
| Responses Affecting New Development |
| For example, spatial planning, development layouts that take account of flood risk, resilient construction and moving vulnerable development. |
Information contained in table from (Sayers, 2012)
The current recommendation of the TE2100 Project is to set the maximum number of times the barrier should close to 50 times per year (The National Archives, 2010). By limiting the number of times the barrier will be shut will reduce the chance of it failing to unacceptable levels.
One option currently being considered to provide an increased level of protection is the modification of the Thames Barrier. Figure 10.2.1 shows how the revolving sector gates may be modified to provide protection against an additional 1.2m of water. Modifying the structure, along with enhancing the other tidal defence structures, is thought to be able to provide a further 100 years of defence (Lavery & Donovan, 2005).
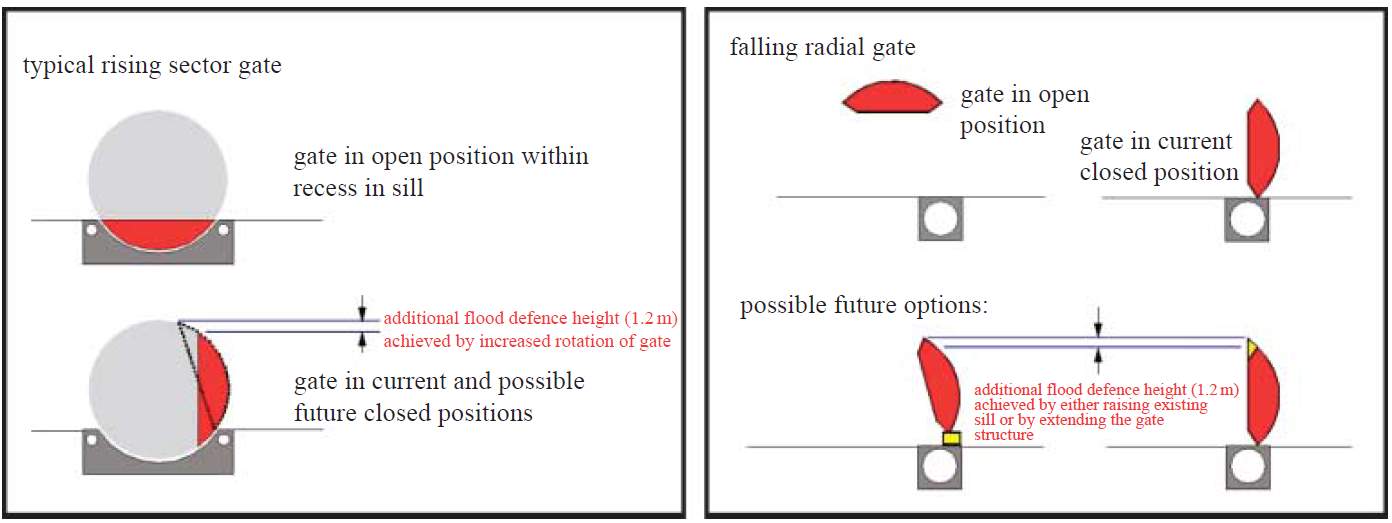
Figure 10.2.1: Possible Modification of the Thames Barrier
Source: (Lavery & Donovan, 2005)
Cite This Work
To export a reference to this article please select a referencing stye below:
Related Services
View all


Related Content
All TagsContent relating to: "Climate Change"
Climate change describes large changes in global or local weather patterns and global warming generally considered to be largely caused by an international increase in the use of fossil fuels from the mid-20th century onwards.
Related Articles

DMCA / Removal Request
If you are the original writer of this dissertation and no longer wish to have your work published on the UKDiss.com website then please: