Load Forecasting for Peak Power Station Using Artificial Intelligence
Info: 8696 words (35 pages) Dissertation
Published: 9th Dec 2019
Abstract
The purpose of this study is to design a peak load forecasting system for the peak power station by utilizing artificial neural network. There are four designing tasks that will be applied for the designing of artificial neural network in the electrical load forecasting. The peak load forecasting may be affected by many impact factors such as temperature, weather or time where it will be considered in the research. Therefore, the first task is to pre-process these factors and load data before it is used in the neural network. The data will be arranged in such a way, so that, the neural network will be designed to learn the relationship among past, current, and future of the factors and the load data. From the relationship, the neural network shall be able to forecast the peak load data for 24 hours ahead. Finally, the peak load data that is forecasted will be compared with the actual peak load data. The percentage of error of the forecasted peak data and the actual peak data must be within a set range in order to achieve an accurate forecasting load data.
Table of Content PAGE
Abstract i
Chapter 1: Introduction
1.1 Research Background 1
1.2 Problem Statement/Research Question 1
1.3 Research Question 2
1.4 Research Scope 2
1.5 Research Contribution/ Significance 3
1.6 Summary 3
Chapter 2: Literature Review
2.1 Introduction 4
2.2 Concept and Theory 5-8
2.3 Literature Review 8-15
2.4 Research Framework 16
2.5 Summary 16
Chapter 3: Methodology
3.1 Methodology 17-20
Chapter 4: Conclusion 21
Reference 22-23
Chapter 1: Introduction
- Research Background
- Problem Statement/ Research Question
- Research Objectives
- Research Scope
- Research Contribution/ Significance
- Summary
Chapter 2: Literature Review
2.1 Introduction In this chapter, the contain will divided into three part. The first part is the concept and theory about load forecasting that will used in the research. In the second part literature review on the load forecasting will be discussed and last the research frame work will be discussed. The first part of this chapter which is the concept and theory will discuss the method that will use to accomplish this research. Peak load forecasting consist of three type which divide to long-term load forecasting, medium-term load forecasting and short-term load forecasting. Each type of forecasting is divided by the period of the forecast and the method to forecast is different for long-term, medium-term and short-term forecasting. For long-term load forecasting, the forecast period is between one week to one year and medium-term load forecasting is forecast for few weeks. Lastly for short-term forecasting the casting period is with-in day-to-day ahead forecasting. The concept to short-term forecasting will discuss at this part. Besides that, in the part of concept and theory will discuss on the method to forecast the load forecasting will be done. The method is data pre-processing, neural network design, neural network implementation and validation. This four step is to arrange the data in a form so the neural network can be read as data. Then the designing or programming the network with the relationship of the past load data and various factor. After that, implement of the network will be done and lastly validation is to track the percentage error and reducing it. For the second part of this chapter, the literature review will be discuss on the research paper that have review based on this title. Beside, in this chapter, the factor such as temperature and time factor will be discuss here. For example, the load demand in night will be higher than afternoon or morning due to the application of the load. The neural network will discuss at here too. Lastly in the third part of the chapter is about research framework. In this part will explain of the concepts and, together with the definitions and reference to relevant scholarly literature, existing theory that is used for my particular study. 2.2 Concept and Theory A proper operation of electric utilities will requires short-term, medium and long-term forecasting of load demand. The load forecasting in this research will focus on short-term forecasting of load demand. A medium and long-term load forecasting with the forecasted times which long enough to one year ahead, this can helps to plan for long-term maintenance, construction scheduling for developing new generation facilities, purchasing of generating units, developing transmission and distribution systems. However, the accuracy of the medium and long-term load forecast will bring influence on developing future generation and distribution planning. In the medium and long-term electric load demand is depends on a complex factor such as daily and seasonal weather, national economic growth and social habits (Mbamalu and El-Hawary, 1993). These factor consist of high nonlinear characteristic and hard to achieve an accurate forecasting results for medium and long-term electric load demand. Short-term load forecasting is forecast load demand for several hours to several weeks ahead using various factor such as temperature and based on the observed load time series data. For power generating station, load forecasting become an important aspect in develop any model for electrical planning and the past load and weather information are critical to predict the forecasting result. However, the various factor that influence the forecasting are too many. For example, the time factor, in the weekend the electric uses will be higher demand compare with weekdays and the special days like New Year, Chinese New Year, and Deepavali will have the power demand higher than any normal days. All these data, must let the neural network to train. Therefore, the percentage of error during forecasting will be higher (Zhang et al., 1998). Other than that, the method of designing a neural network based of forecast should be include to be discuss in this chapter. As mention in the introduction of the proposal, there are four important task should be done in sequence, so that a good structure of neural network can be build. The four design task planning is- Data pre-processing
- Neural Network design
- Neural Network implementation
- Validation
- Iterative Forecasting
- Multi-model forecasting
- Single model forecasting
- Temperature
- Humidity
- Precipitation
- Wind speed and wind chill
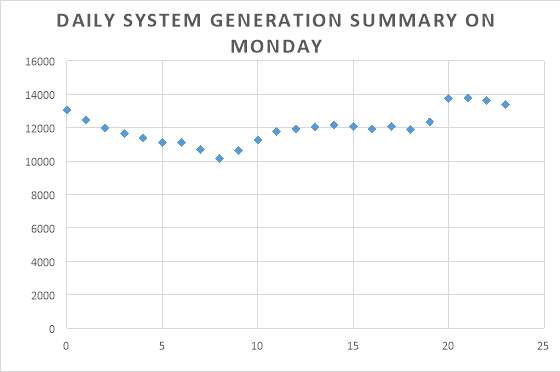 Graph 1: Total power generate on Monday 22th MAY 2017 generation of power station.
From the observation of daily load curve of any grid station it can be seen that load variation follows certain rules with the “time point” of the day. In graph hourly load curves is shown for 24 hours of a day. The interval of each point is one hour, so there are 24 intervals in the figure. It can be seen in figure that the load is low and stable from 0 am to 8 am (0am means 12 o clock at night), the load start rising at 9 o clock till 2 pm.
After that it descends till 4 pm (16:00 in graph) and after 6 pm it start rising till 8 pm (20:00), after 8 pm load gradually decrease again until the end of the day. It can be seen in figure 1.1 that maximum demand occurs at 8pm, and minimum load demand occurs after mid night. So if we closely observe this load curve it can be seen that load demand reflects the consumer’s daily life style. At mid night everyone is sleeping so there is no need of lighting in the house, so load becomes least. Similarly at 8 pm everyone is at home watching TV, doing homework, so load is highest at that part of the day.
From the graph we can know the people’s daily life activities can be classified in to three parts
Graph 1: Total power generate on Monday 22th MAY 2017 generation of power station.
From the observation of daily load curve of any grid station it can be seen that load variation follows certain rules with the “time point” of the day. In graph hourly load curves is shown for 24 hours of a day. The interval of each point is one hour, so there are 24 intervals in the figure. It can be seen in figure that the load is low and stable from 0 am to 8 am (0am means 12 o clock at night), the load start rising at 9 o clock till 2 pm.
After that it descends till 4 pm (16:00 in graph) and after 6 pm it start rising till 8 pm (20:00), after 8 pm load gradually decrease again until the end of the day. It can be seen in figure 1.1 that maximum demand occurs at 8pm, and minimum load demand occurs after mid night. So if we closely observe this load curve it can be seen that load demand reflects the consumer’s daily life style. At mid night everyone is sleeping so there is no need of lighting in the house, so load becomes least. Similarly at 8 pm everyone is at home watching TV, doing homework, so load is highest at that part of the day.
From the graph we can know the people’s daily life activities can be classified in to three parts
- Working Time
- Leisure Time
- Sleeping Time
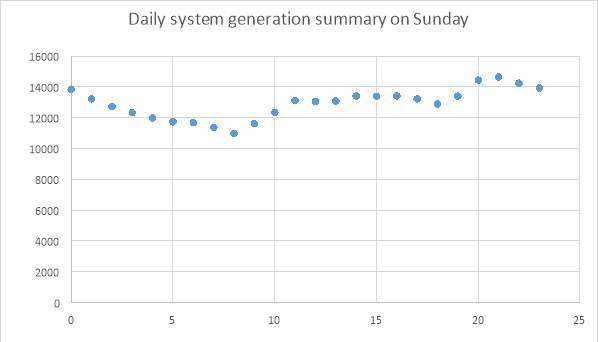 Graph 2: Total power generate on Sunday 21th MAY 2017 generation of power station.
For example is observed on graph 2, weekend load to be high than the week day loads due to the increase of leisure time.
The start of semester of universities or school year also has the significant impact on load consumption and thus changes the load profile. Similarly day light saving can also decrease the average daily load also it shift the peaks from one time spot to the other. It is noticed from the collected load data that the load curve is periodic. This periodicity of load occurs not only in the daily load but periodicity is present in weekly, monthly and seasonal and yearly load curves. This is very important property of load curve because by taking periodicity of load in to account we can forecast load with more effectively.
Artificial Neural network
Other than review on factor that affect the load forecasting, learning artificial neural network also important for the peak load forecasting. Artificial neural network are mathematical tool that mimic the way of human brain processes information. Neural network consist neurons where it is to enable data receiving through a number of input nodes, process it and put out the responses based on the input data given. The neuron is divided in two stages process which the first state is to combine the input values and the result will used as the argument of a non-linear activation function. For example, given the input set of data of the temperature is X and load demand is Y, this will give a relationship between the two variable. When the input of one nodes is depend on the output of the previous nodes this method is known as feed-forward and the layer between the input nodes and the output nodes is known as hidden layer. Neurons that be organized in multiple layers which known as multilayer perceptron (MLP). However, all the layer that been arranged will not connect with each other (Neural Networks, n.d.).
Graph 2: Total power generate on Sunday 21th MAY 2017 generation of power station.
For example is observed on graph 2, weekend load to be high than the week day loads due to the increase of leisure time.
The start of semester of universities or school year also has the significant impact on load consumption and thus changes the load profile. Similarly day light saving can also decrease the average daily load also it shift the peaks from one time spot to the other. It is noticed from the collected load data that the load curve is periodic. This periodicity of load occurs not only in the daily load but periodicity is present in weekly, monthly and seasonal and yearly load curves. This is very important property of load curve because by taking periodicity of load in to account we can forecast load with more effectively.
Artificial Neural network
Other than review on factor that affect the load forecasting, learning artificial neural network also important for the peak load forecasting. Artificial neural network are mathematical tool that mimic the way of human brain processes information. Neural network consist neurons where it is to enable data receiving through a number of input nodes, process it and put out the responses based on the input data given. The neuron is divided in two stages process which the first state is to combine the input values and the result will used as the argument of a non-linear activation function. For example, given the input set of data of the temperature is X and load demand is Y, this will give a relationship between the two variable. When the input of one nodes is depend on the output of the previous nodes this method is known as feed-forward and the layer between the input nodes and the output nodes is known as hidden layer. Neurons that be organized in multiple layers which known as multilayer perceptron (MLP). However, all the layer that been arranged will not connect with each other (Neural Networks, n.d.).
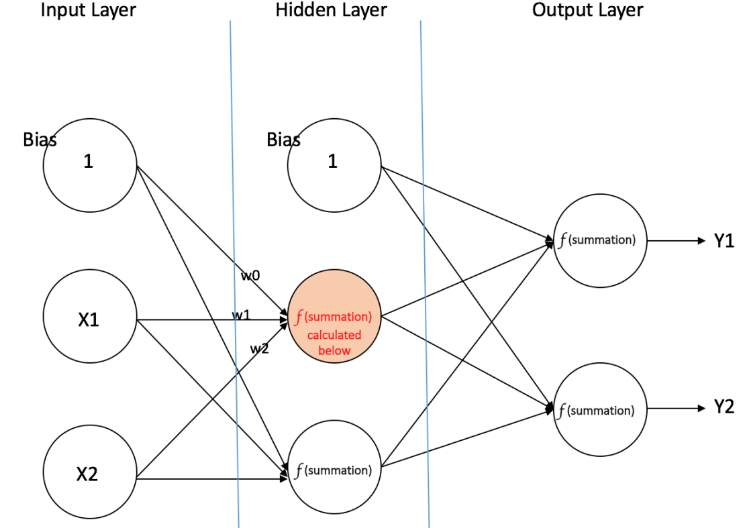 Figure 1: Multilayer perceptron with input layer, output layer and hidden layer.(“A Quick Introduction to Neural Networks,” n.d.)
Multilayer perceptron have the ability to estimate the parameter which known as “training” of the network. Training is use the data which consist of the input and associated output vectors. During training the multilayer perceptron is repeatedly presented with the training data and the weights in the network are adjusted until the desired input—output mapping occurs. Multilayer perceptron learn in a supervised manner. During training the output from the multilayer perceptron, for a given input vector, may not equal the desired output. An error signal is defined as the difference between the desired and actual output. Training uses the magnitude of this error signal to determine to what degree the weights in the network should be adjusted so that the overall error of the multilayer perceptron is reduced. There are many algorithms that can be used to train a multilayer perceptron.
Training a multilayer perceptron is the procedure by which the values for the individual weights are determined such that the relationship the network is modelling is accurately resolved. At this point we will consider a simple multilayer perceptron that contains only two weights. For any combination of weights the network error for a given pattern can be defined. By varying the weights through all possible values, and by plotting the errors in three-dimensional space, we end up with a plot like the one shown in figure 1. Such a surface is known as an error surface. The objective of training is to find the combination of weights which result in the smallest error. In practice, it is not possible to plot such a surface due to the multitude of weights. What is required is a method to find the minimum point of the error surface.
Base load
Base load is the minimum level of electricity demand on an electrical grid over a period of 24 hours. The power sources for base load are from power station know baseload plant, which can generate the electrical power needed to satisfy the minimum demand. Baseload plant is an energy station devoted to the production of base load supply which are the production facilities used to supply a continuous energy demand, and produce energy at a constant rate. Besides that, these plants will run all times through the year except in the case of repairs or maintenance and often designed for relatively high efficiency. Each baseload power plant on a grid is giving a specific amount of the base load power demand to handle and base load power is determined by the load duration curve of the system. For a power system, the rule of thumb is that the base load power is usually 35-40% of the maximum load during the year. There are some renewable energy can provide base load power such as hydroelectric, geothermal, biogas, ocean thermal as well as solar thermal with storage.
Peak load
Peak load means the time of high demand and the peaking demands are always require for only shorter durations. Peak demand could be explain as the difference between the base demand and the highest demand. For examples, the household loads such as microwave oven, electrical cooking apparatus, and television will switch on for a short period of time. Peaking power plants are power plants that will run only when there is a high demand for electricity. Due to peak power plant supply power only for certain period, the power supplied commands a much higher price per kilowatt hour than base load power. Peak load power plants will combination with base load power plants, which supply a dependable and consistent amount of electricity to meeting the minimum demand. The peak load power plants are generally use the natural gas as the power source but there are few burn diesel oil and petroleum.
Intermediate load
Intermediate load is refer as the range from base load to a point between base load and peak. The mains load resulting from the power requirements of the consumers must be covered by power plant operation adjusted in terms of time. Base load, intermediate load and peak load are distinguished in this context. The power plants are used in these ranges according to their operational and economic properties. Hydro-electric, lignite-fired and nuclear power plants run base load, coal-fired and gas-fired power plants run intermediate load, and storage and pumped storage power plants as well as gas turbine facilities cover peak loads. Intermediate load plants run more frequent than peak power plant, but lesser than base-load plant.
Power plant
Power plant, also refer as power station or power house, is an industrial facility for the generation of electric power. Some of the power plant contain more than one generators and machine that converts mechanical power into electrical power. There are many type of power plant where some will use relative motion between magnetic field and a conductor creates an electrical power. Most of the power station will use natural resource to generate power such as coal, natural gas and petroleum but there is an increasing use of renewable source such as solar, wind, wave and hydroelectric.
2.4 Research Framework
There are many research paper in the development of a short-term load forecasting model based on Artificial Neural Network. In few months earlier, there are research about short-term residential load forecasting based on resident behavior learning. The research aim for a Long-Short Term Memory based deep learning forecasting framework with appliance consumption sequences is proposed to address such volatile problem(Kong et al., 2017). The forecasting result shown that the forecasting accuracy can be notably improved by including appliance measurements in the training data. The effectiveness of the proposed method is validated through extensive comparison studies on a real-world dataset. At the end of the research, the proposed LSTM recurrent neural network based forecasting framework performs better in establishing meaningful temporal relationships between consumptions across time intervals. Besides, when there are consumption sequences of major appliances are available, they can further improve the meter-level forecasting accuracy under the proposed LSTM framework. This research paper have include many contextual variables such temperature, humidity, the day of the week and special events to increase the accuracy.
Besides that, the research on “artificial neural network based monthly load curves forecasting” have review others method besides artificial neural network(Barbulescu et al., 2016). There have make a comparison between the ANN and ANFIS (adaptive neuro-based fuzzy inference system) for short term load forecasting is performed in other research paper. Real data have been used, being represented by the load and temperature data in Turkey. Backpropagation algorithm has been implemented. The comparison is provide more idea and method for the load forecasting.
2.5 Summary
As discuss earlier, load forecasting is important for future planning and controlling of a power station. While peak load forecasts are important for planning but in particular, it more for securing adequate generation, transmission and distribution capacities. In more specific, peak forecasts are important in decision making capabilities in capital expenditures and improve reliabilities of the system. Therefore, low accuracy of peak load forecasting will lead to bad planning and inefficient operation of power plant station.
Figure 1: Multilayer perceptron with input layer, output layer and hidden layer.(“A Quick Introduction to Neural Networks,” n.d.)
Multilayer perceptron have the ability to estimate the parameter which known as “training” of the network. Training is use the data which consist of the input and associated output vectors. During training the multilayer perceptron is repeatedly presented with the training data and the weights in the network are adjusted until the desired input—output mapping occurs. Multilayer perceptron learn in a supervised manner. During training the output from the multilayer perceptron, for a given input vector, may not equal the desired output. An error signal is defined as the difference between the desired and actual output. Training uses the magnitude of this error signal to determine to what degree the weights in the network should be adjusted so that the overall error of the multilayer perceptron is reduced. There are many algorithms that can be used to train a multilayer perceptron.
Training a multilayer perceptron is the procedure by which the values for the individual weights are determined such that the relationship the network is modelling is accurately resolved. At this point we will consider a simple multilayer perceptron that contains only two weights. For any combination of weights the network error for a given pattern can be defined. By varying the weights through all possible values, and by plotting the errors in three-dimensional space, we end up with a plot like the one shown in figure 1. Such a surface is known as an error surface. The objective of training is to find the combination of weights which result in the smallest error. In practice, it is not possible to plot such a surface due to the multitude of weights. What is required is a method to find the minimum point of the error surface.
Base load
Base load is the minimum level of electricity demand on an electrical grid over a period of 24 hours. The power sources for base load are from power station know baseload plant, which can generate the electrical power needed to satisfy the minimum demand. Baseload plant is an energy station devoted to the production of base load supply which are the production facilities used to supply a continuous energy demand, and produce energy at a constant rate. Besides that, these plants will run all times through the year except in the case of repairs or maintenance and often designed for relatively high efficiency. Each baseload power plant on a grid is giving a specific amount of the base load power demand to handle and base load power is determined by the load duration curve of the system. For a power system, the rule of thumb is that the base load power is usually 35-40% of the maximum load during the year. There are some renewable energy can provide base load power such as hydroelectric, geothermal, biogas, ocean thermal as well as solar thermal with storage.
Peak load
Peak load means the time of high demand and the peaking demands are always require for only shorter durations. Peak demand could be explain as the difference between the base demand and the highest demand. For examples, the household loads such as microwave oven, electrical cooking apparatus, and television will switch on for a short period of time. Peaking power plants are power plants that will run only when there is a high demand for electricity. Due to peak power plant supply power only for certain period, the power supplied commands a much higher price per kilowatt hour than base load power. Peak load power plants will combination with base load power plants, which supply a dependable and consistent amount of electricity to meeting the minimum demand. The peak load power plants are generally use the natural gas as the power source but there are few burn diesel oil and petroleum.
Intermediate load
Intermediate load is refer as the range from base load to a point between base load and peak. The mains load resulting from the power requirements of the consumers must be covered by power plant operation adjusted in terms of time. Base load, intermediate load and peak load are distinguished in this context. The power plants are used in these ranges according to their operational and economic properties. Hydro-electric, lignite-fired and nuclear power plants run base load, coal-fired and gas-fired power plants run intermediate load, and storage and pumped storage power plants as well as gas turbine facilities cover peak loads. Intermediate load plants run more frequent than peak power plant, but lesser than base-load plant.
Power plant
Power plant, also refer as power station or power house, is an industrial facility for the generation of electric power. Some of the power plant contain more than one generators and machine that converts mechanical power into electrical power. There are many type of power plant where some will use relative motion between magnetic field and a conductor creates an electrical power. Most of the power station will use natural resource to generate power such as coal, natural gas and petroleum but there is an increasing use of renewable source such as solar, wind, wave and hydroelectric.
2.4 Research Framework
There are many research paper in the development of a short-term load forecasting model based on Artificial Neural Network. In few months earlier, there are research about short-term residential load forecasting based on resident behavior learning. The research aim for a Long-Short Term Memory based deep learning forecasting framework with appliance consumption sequences is proposed to address such volatile problem(Kong et al., 2017). The forecasting result shown that the forecasting accuracy can be notably improved by including appliance measurements in the training data. The effectiveness of the proposed method is validated through extensive comparison studies on a real-world dataset. At the end of the research, the proposed LSTM recurrent neural network based forecasting framework performs better in establishing meaningful temporal relationships between consumptions across time intervals. Besides, when there are consumption sequences of major appliances are available, they can further improve the meter-level forecasting accuracy under the proposed LSTM framework. This research paper have include many contextual variables such temperature, humidity, the day of the week and special events to increase the accuracy.
Besides that, the research on “artificial neural network based monthly load curves forecasting” have review others method besides artificial neural network(Barbulescu et al., 2016). There have make a comparison between the ANN and ANFIS (adaptive neuro-based fuzzy inference system) for short term load forecasting is performed in other research paper. Real data have been used, being represented by the load and temperature data in Turkey. Backpropagation algorithm has been implemented. The comparison is provide more idea and method for the load forecasting.
2.5 Summary
As discuss earlier, load forecasting is important for future planning and controlling of a power station. While peak load forecasts are important for planning but in particular, it more for securing adequate generation, transmission and distribution capacities. In more specific, peak forecasts are important in decision making capabilities in capital expenditures and improve reliabilities of the system. Therefore, low accuracy of peak load forecasting will lead to bad planning and inefficient operation of power plant station.
Chapter 3: Proposed Methodology
In this chapter, the planning of the project will be proposed and discussed. The management planning of this project will be listed out. Table 1: Plan activity of the project for first semester.
Get the power load data and daily weather.

Extract the data such as peak power and temperature for every hours

Design the structure of the neural network.

Implement the neural network by training with new data.


Test for neural network
Neneural

Reset training data

Low error of percentage
Flow chart 1: The plan for designing neural network work for the load forecasting.
Research Planning (Gantt Chart)
Gantt Chart 1: The work plan for first semester
| ACTIVITY | PERIODS | |||||||||||||
| 1 | 2 | 3 | 4 | 5 | 6 | 7 | 8 | 9 | 10 | 11 | 12 | 13 | 14 | |
| Meet for discussion on final year title | ||||||||||||||
| Review peak power station | ||||||||||||||
| Review load forecasting | ||||||||||||||
| Review neural network | ||||||||||||||
| Write proposal form | ||||||||||||||
| Write abstract | ||||||||||||||
| Write Introduction | ||||||||||||||
| Write literature review | ||||||||||||||
| Write methodology | ||||||||||||||
| Submit proposal and do stimulation for load forecasting | ||||||||||||||
| Prepare for presentation | ||||||||||||||
| Do stimulation for load forecasting | ||||||||||||||
| Presentation for proposal defense | ||||||||||||||
| Do stimulation for load forecasting | ||||||||||||||
| ACTIVITY | PERIODS | ||||||||||||
| 1 | 2 | 3 | 4 | 5 | 6 | 7 | 8 | 9 | 10 | 11 | 12 | 13 | |
| Build prototype Neural Network design | |||||||||||||
| Neural Network Implement and validation | |||||||||||||
| Start writing thesis | |||||||||||||
| Pass up thesis | |||||||||||||
| Prepare for presentation | |||||||||||||
| Presentation for project | |||||||||||||
Chapter 4: Conclusion
As the conclusion, the peak load forecasting is design for forecast the peak load on the power generating station. Peak power plant is not operate for the whole day, it only operate for the peak hours. Therefore, the load forecasting need to be accurate. In order to achieve the high accuracy, the various factor such as temperature, peak hours and weather will include as the data for implementation. The high accuracy forecasting is important for planning and operate the power plant station to the maximum efficiency.References
A Quick Introduction to Neural Networks [WWW Document], n.d. URL http://www.kdnuggets.com/2016/11/quick-introduction-neural-networks.html/2 (accessed 8.1.17). Anders, U., Korn, O., 1999. Model selection in neural networks. Neural Netw. 12, 309–323. doi:10.1016/S0893-6080(98)00117-8 Armstrong, J.S., 2011. Illusions in Regression Analysis (SSRN Scholarly Paper No. ID 1969740). Social Science Research Network, Rochester, NY. Armstrong, J.S., Fildes, R., 1995. Correspondence on the selection of error measures for comparisons among forecasting methods. J. Forecast. 14, 67–71. doi:10.1002/for.3980140106 Barbulescu, C., Kilyeni, S., Deacu, A., Turi, G.M., Moga, M., 2016. Artificial neural network based monthly load curves forecasting, in: 2016 IEEE 11th International Symposium on Applied Computational Intelligence and Informatics (SACI). Presented at the 2016 IEEE 11th International Symposium on Applied Computational Intelligence and Informatics (SACI), pp. 237–242. doi:10.1109/SACI.2016.7507378 Box, G.E.P., Jenkins, G.M., Reinsel, G.C., Ljung, G.M., 2015. Time Series Analysis: Forecasting and Control. John Wiley & Sons. D.C., P., M.A., E.-S., R.J., M., n.d. Electric load forecasting using an artificial neural network - IEEE Xplore Document [WWW Document]. URL http://ieeexplore.ieee.org/abstract/document/76685/ (accessed 8.1.17). Demuth, H.B., Beale, M.H., De Jess, O., Hagan, M.T., 2014. Neural Network Design, 2nd ed. Martin Hagan, USA. Drezga, I., Rahman, S., 1998. Input variable selection for ANN-based short-term load forecasting. IEEE Trans. Power Syst. 13, 1238–1244. doi:10.1109/59.736244 Hill, T., Marquez, L., O’Connor, M., Remus, W., 1994. Artificial neural network models for forecasting and decision making. Int. J. Forecast. 10, 5–15. doi:10.1016/0169-2070(94)90045-0 Kalaitzakis, K., Stavrakakis, G.S., Anagnostakis, E.M., 2002. Short-term load forecasting based on artificial neural networks parallel implementation. Electr. Power Syst. Res. 63, 185–196. doi:10.1016/S0378-7796(02)00123-2 Kiartzis, S.J., Zoumas, C.E., Theocharis, J.B., Bakirtzis, A.G., Petridis, V., 1997a. Short-term load forecasting in an autonomous power system using artificial neural networks. IEEE Trans. Power Syst. Vol. 12. Kiartzis, S.J., Zoumas, C.E., Theocharis, J.B., Bakirtzis, A.G., Petridis, V., 1997b. Short-term load forecasting in an autonomous power system using artificial neural networks. IEEE Trans. Power Syst. 12, 1591–1596. doi:10.1109/59.627863 Kong, W., Dong, Z.Y., Hill, D.J., Luo, F., Xu, Y., 2017. Short-Term Residential Load Forecasting based on Resident Behaviour Learning. IEEE Trans. Power Syst. PP, 1–1. doi:10.1109/TPWRS.2017.2688178 Mbamalu, G., El-Hawary, M., 1993. Load forecasting via suboptimal seasonal autoregressive models and iteratively reweighted least squares estimation [WWW Document]. ResearchGate. doi:http://dx.doi.org/10.1109/59.221222 Neural Networks, n.d. Paravan, D., Debs, A., Hansen, C., Becker, D., Hirsch, P., Golob, R., n.d. Influence of Temperature on Short-Term Load Forecasting Using the EPRI-ANNSTLF. Shimakura, Y., Fujisawa, Y., Maeda, Y., Makino, R., Kishi, Y., Ono, M., Fann, J.Y., Fukusima, N., 1993. Short-term load forecasting using an artificial neural network, in: [1993] Proceedings of the Second International Forum on Applications of Neural Networks to Power Systems. Presented at the [1993] Proceedings of the Second International Forum on Applications of Neural Networks to Power Systems, pp. 233–238. doi:10.1109/ANN.1993.264285 Song, K.-B., Baek, Y.-S., Hong, D.H., Jang, G., 2005. Short-term load forecasting for the holidays using fuzzy linear regression method. IEEE Trans. Power Syst. 20, 96–101. doi:10.1109/TPWRS.2004.835632 Tong, C., Li, J., Lang, C., Kong, F., Niu, J., Rodrigues, J.J.P.C., 2017. An efficient deep model for day-ahead electricity load forecasting with stacked denoising auto-encoders. J. Parallel Distrib. Comput. doi:10.1016/j.jpdc.2017.06.007 Usman Fahad, M., Arbab, N., 2014. Factor Affecting Short Term Load Forecasting. J. Clean Energy Technol. Vol. 2. Zhang, G., Eddy Patuwo, B., Y. Hu, M., 1998. Forecasting with artificial neural networks: Int. J. Forecast. 14, 35–62. doi:10.1016/S0169-2070(97)00044-7Cite This Work
To export a reference to this article please select a referencing stye below:
Reference Copied to Clipboard.
Reference Copied to Clipboard.
Reference Copied to Clipboard.
Reference Copied to Clipboard.
Reference Copied to Clipboard.
Reference Copied to Clipboard.
Reference Copied to Clipboard.
Related Services
View all


Related Content
All TagsContent relating to: "Artificial Intelligence"
Artificial Intelligence (AI) is the ability of a machine or computer system to adapt and improvise in new situations, usually demonstrating the ability to solve new problems. The term is also applied to machines that can perform tasks usually requiring human intelligence and thought.
Related Articles

DMCA / Removal Request
If you are the original writer of this dissertation and no longer wish to have your work published on the UKDiss.com website then please: