Gas Chromatogram Flame Ionization Detector Multicomponent Sample Analysis
Info: 13084 words (52 pages) Dissertation
Published: 10th Dec 2019
Tagged: Chemistry
Abstract:
An analysis for effects of the chemical properties in multicomponent samples were explored utilizing the Gas Chromatogram Flame Ionization Detector, Agilent 7890. A multicomponent sample was analyzed in the non-polar and polar analytical columns and measured for plate height, plate number and resolution. Plate number was calculated by the compound octane. The plate heights for 1-pentanol and octane, for the non-polar and polar columns, are 0.000611m, 0.000294 m, 0.0000240 m, and 0.000049 m, respectively. The plate heights for the non-polar and polar analytical columns were 102041 and 604839, respectively. The resolution of the peaks for each column, non-polar and polar, were 8.37 and 92.37, respectively.
Table of Contents
Introduction
The chromatography field comprises a group of methods that produce an analysis for multicomponent samples. The complexity introduced by such samples pose a problem for classical methods of separations such as extraction, distillation and precipitation; efficiency and accuracy may suffer with the use of aforementioned methods. However, through the utilization of analytical methods, efficiency and accuracy have improved tremendously.
There are two known types of gas chromatography: gas-liquid chromatography and gas-solid chromatography. The most common type, however, is the gas-liquid chromatography, which is usually referred to as gas chromatography. Essentially, gas chromatography involves the vaporization of the sample, which is then injected into the column. Elution begins to take place with the help of the mobile gas; in this lab, nitrogen is the mobile gas. The detector then detects and documents the peaks.
The separation of the components in the sample occurs in the analytical column. The analytical column’s efficiency can be quantitatively defined by plate height and plate count. This relationship is shown by Equation 1.
| N= LH | (1) |
Where N is the number of theoretical plates, H is plate height, and L is length of the column packing.
The two variables are inversely related, meaning, the efficiency of the column becomes greater as the plate count increases and the plate height decreases. The column utilized in the experiment was the capillary column. The columns are also referred to as open tubular columns because of the ability of the vaporized sample to freely flow through them. Although there are two types of capillary columns, wall-coated open tubular and support-coated open tubular, the wall-coated open tubular was used for this experiment. This specific type of column is coated with a small layer of stationary phase. Stationary phases should satisfy four properties: low volatility, thermal stability, chemical inertness, resolved solvent characteristics that fall within a suitable range. The
stationary phase that coats the analytical column can be polar or nonpolar. The polarity of the stationary phase effects the elution of the components of the sample through compatibility; for instance, in a polar stationary phase, a polar component would most likely elute quickly versus a nonpolar component. However, in the event that polarity is optimal for more than one component, the boiling points are then taken into consideration. The stationary phases used for the nonpolar analytical column was the HP-5 (5% phenyl methyl silicone and 95% methyl silicone); The polar column contained the HP-225 (50% cyanopropyl silicone and 50% methyl silicone). The structures that make up the stationary phase is shown in Figures A and B.


 +
+ 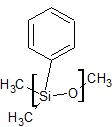
Figure A. A basic schematic of the inner part of the analytical column with a nonpolar stationary phase. The blue ring represents the thin layer of the phase. The structures are the skeletons of the compounds that make up the stationary phase. The first structure is methyl silicone and the second structure is phenyl methyl silicone.


 +
+ 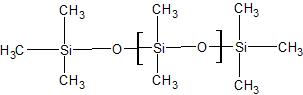
Figure B. A basic schematic of the analytical column with a polar stationary phase. The red ring represents the thin layer of the phase. The skeletons of the structure that make up the polar stationary phase are provided. The first structure is cyanopropyl and the following structure is methyl silicone.
An analysis was conducted on a multicomponent mixture containing hexane as the solvent, octane, undecane and 1-hexanol. The gas chromatography documented interaction between the sample and the polarity of the column. The flame ionization detector was specifically used for this experiment. The elution times were then shown in a Retention Time vs. Ion Current for both the nonpolar and polar stationary phases.
Instrumental Theory and Equipment
Gas chromatography is a common instrument used to analyze and separate samples. The gas chromatograph separates very volatile solutions by using high temperatures. When separating the mixtures, the GC helps to overcome signal overlap problems by using external standards. In a GC the carrier gas is N2 and depending on the detector used the makeup gas used can be helium or nitrogen. For a flame ionization detector, helium or nitrogen can be used, but there normally is no makeup gas used because the FID does not depend on the concentration and the sensitivity is not affected greatly by the use of makeup gases. Instead of using a makeup gas the FID is designed to just use air, hydrogen and the carrier gas. In this lab, a capillary GC column was used. In other gas chromatographs a packed column could be used. A few benefits of using a capillary column is, there are more theoretical plates per meter and the columns can be longer because there is less resistance to the flow. However, there are some limitations when using a capillary column. A capillary column has a much smaller diameter than a packed column and this means that a specialized injector and pressure controller must be used. The sample that is injected into the GC while using a capillary column has to be a smaller amount than when using a packed column to keep the column from overloading. When setting up the GC, the parameters are changed depending on what is desired, and this will affect the elution time of the sample and the peak width of the different compounds in the mixture. Once the mixture is injected into the machine, it goes through the split valve which can send some of the sample back into the room depending on what split ratio was set up and then goes through the analytical column where the sample is separated. When it exits the column, the sample is then burned in the FID and as each compound exits it creates a peak in the chromatogram. The signal generated from the FID is recorded on the computer that controls the gas chromatograph.
Over the years, many different detectors have been used with gas chromatographic separations. These detectors have been studied intensively in order to insure their characteristics are ideal for gas chromatography. The ideal detector for GC would have good sensitivity properties and be stable and reproducible. The perfect detect would also have a linear response that extends several magnitudes. Additionally, the temperature would need to be able to get up to at least 400-degree Celsius and have a short response time independent of flow rate. The detector would have to be easy to use, be nondestructive, and have a similar response toward all solutes. However, no detector has ALL of these qualities. There are detectors that compromise a few of these characteristics though. Along with the flame ionization detector, other detectors include; a thermal conductivity detector, an electron-capture detector, and a mass spectrometer detector. Below, schematics have been drawn of these 3 additional detectors.
Figure 1 is a schematic of a thermal conductivity detector (TCD). The TCD is widely used and very common, it is actually one of the first few detectors used and studied in GC instruments. The TCD works by a heated element like platinum, gold, or tungsten. This detector works by comparing the electrical resistance of the element used with the thermal conductivity of the carrier gas. Figure 2 is schematic of an Electron-Capture Detector, (ECD). In recent experiments, the ECD has been used for environmental samples. This detector has specific selectivity properties that can respond to halogen containing organic compounds. The ECD works by the ionization and the production of a burst of electrons from the emitter. This happens when the electron from the emitter interacts with the carrier gas. Figure 3 is a schematic of a mass spectrometry detector. Mass spectrometers are the most powerful detectors used in GC. Mass Spec measures ions and the ratio of mass and charge. This detector works by turning atoms into ions and these ions are then deflected.
Figure 4 is a schematic of the gas chromatograph that was used in this lab. Figure 5 is a detailed schematic of the Flame Ionization Detector (FID). The FID is responsible for the burning of the sample. The sample is brought down from the column and directed into the air-hydrogen flame. The FID has a positive and negative electrode and the carbon ions are formed between the two electrodes. The current size generated from the carbon atoms is directly proportional to the number of carbon atoms in the flame. As the compounds exit the column, peaks are recorded on a chromatogram. The chromatogram is recorded as the ion current versus the retention time.
Figure 6 is a schematic of the injector. The injector is responsible for the vaporization of the sample that is injected into the nitrogen gas. The injector will put some of the sample back into the room and the rest into the analytical column. The amount of sample thrown back into the room depends on the split ratio set in the parameters setting on the computer. In this experiment a split/splitless capillary injector was used. The requirements for this type of injector into a packed column is the carrier gas, the septum, the septum purge vent, the column connection, injector insert and the split vent. For this design the carries gas, N2, flows onto the column at a constant rate to maintain the set requirements of the column and produce reproducible results and times for the compounds. The amount of gas that is released through the vent is controlled by the amount entering the column. When the split valve is closed, then all of the sample goes through into the column. Even when the amount of sample injected into the GC is about one microliter that could still be too much for the detector to give viable results on the chromatogram. When the computer sets the split vent to be completely open, then most of the sample that has been vaporized gets thrown back out through the vent and only a small amount of the sample runs through into the analytical column. The key component to a split or splitless injection is having the function to keep the amount of flow rate on the column be constant while the amount of sample exiting through the split vent. Having a split injection will negate the need to make a sample dilution.


 Reference Sample
Power supply
Output
Amplifier
Figure 1: Schematic diagram of a TCD


Insulator
 Radioactive β emitter


 Out into room From the column
Insulator
Positive Electrode Negative Electrode
Figure 2: schematic diagram of an ECD


 Ion source region
Electron
Multiplier

Focusing Lenses Mass analyzer region
Figure 3: Schematic of a Mass Spectrometer Detector


 1
1
2
 3
3
9 10


12
11


8


5
4


 6
6

7
 13
13
6

 13 13
13 13
Figure 4: Schematic of a Gas Chromatograph coupled to a flame ionization detector
 **1. The mobile phase gas cylinder 2. The pressure regulator 3. The filter 4. The injector 5. The split valve 6. The analytical column 7. The oven fan 8. The flame ionization detector 9, 10. The compressed air and hydrogen cylinders 11. The septum purge vent 12. The split valve vent 13. The computer **


 Ceramic insulator

 Collector Signal Probe

Flame tip assembly


 Column
H2 and make-up air
Figure 5: Flame Ionization Detector


Septum Purge Exhaust
Split Valve
Nitrogen (Mobile Phase) Entry
Split Valve Exhaust

 To the Analytical Column
Figure 5: Schematic of Injector
Materials and Methods
During the first portion of the lab, injections into the gas chromatogram flame ionization detector 7890A were practiced. A DB-5 non-polar column was used with a (5-1-phenyl) methyl polysiloxane stationary phase, a 30-meter-long by 0.32-millimeter internal diameter and a 0.25 micrometer stationary film thickness. To begin the process, the H2, N2, and air compressed gas cylinder valves were opened completely in the counterclockwise position until it stopped. Then all three compressed gas valves with the blue handles on the wall above the tanks were opened. All three compressed gas valves behind the GC were opened. Then the power switch on the front of the GC below the oven door was turned on. The GC-FID detector temperature was set to 250°C and the GC’s inlet or injector temperature was set to 275°C. When the detector temperature reached its temperature set point, the FID was lit by scrolling down to the flame line and pressing the on button. Once the GC was powered on the computer was turned on and the chemstation online software was started. On the computer program, the first method was loaded and let the instrument analyze octane at 0.1 milliliter and hexane at 1.0 milliliter. Under the instrument tab, the edit GC parameters section was selected. The mode for the inlet setting was changed to slit mode and the ratio was set to 9:1. The column settings flow rate was set to 10 mL per minute and the oven settings was set to 80°C for isothermal temperature. In the syringe 1 microliter of air was pulled back, the syringe was put into the sample container and 1 microliter was drawn up. The sample was then injected into the GC and the start button was pressed. For each injection after the initial, one of the parameters were changed to observe a change in the chromatogram that is produced after each injection run. The second and third injection changed the flow rate to 7 mL/min and then to 5 mL/min. For the fourth and fifth injections the flow rate was changed back to 10 mL/min and the oven temperature was changed to 60°C and then 40°C. Then for the final two practice injections the temperature was changed back to 80°C and the split ratio was changed to 19:1 and then to 49:1. After completing consistent injections, a mixture of hexane, as the solvent, undecane, octane and 1-hexanol were mixed together. The boiling points, and polarity of each compound in the mixture were recorded. Then the parameters on the computer were changed back to the initial with the oven temperature at 80°C, the split ratio set to 9:1, and the flow rate was set to 10 mL/min. Then a temperature program was created. The first parameters of the temperature program were set to keep the initial temperature of 40°C on hold for 0.5 minutes and then have a ramp of 215°C with no hold rate and with a rate per °C set to 40°C. The second set of parameters changed the temperature program to add a second ramp. The initial temperature was kept at 40°C with a hold time of 1 minute, the first ramp temperature was set to 100 °C with no hold time and a rate/°C was set to 20°C and the final ramp temperature was set to 215 °C with no hold time and a rate/°C set to 40°C. The final temperature program parameters were set to keep the initial temperature at 40 °C for 0.5 minutes and the first ramp was set to 80 °C with no hold time and a rate per °C of 20 °C. The second ramp was set to 105 °C with no hold time and a rate/°C was set to 20 °C and the final ramp was set to 215 °C with no hold time and a rate/ °C of 40 °C. All three chromatograms were compared to examine the different elution times depending on the parameters set. The same temperature programs would be run through the polar column GC and the results of the chromatograms compared to understand the different elution times.
Data and Experimental Results
Boiling Points Polar or Non-Polar
Hexane (solvent): 68 °C Hexane: Non-polar
Octane: 125 °C Octane: Non-polar
Undecane: 196 °C Undecane: Non-polar
1-hexanol: 157 °C 1-hexanol: Polar
The following results were the data collected from Dr. Thompson. Calculations and discussions are based off of the following results. The chromatograms were analyzed to calculate the plate height and the number of theoretical plates. Mobile phase velocities, peak shapes, split ratios, and resolutions were also analyzed and discussed from the results of the chromatograms.
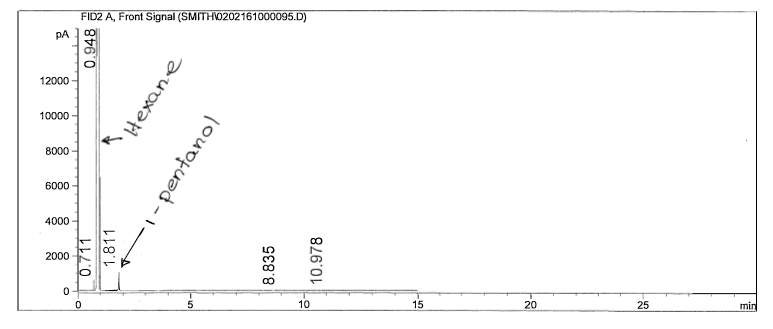
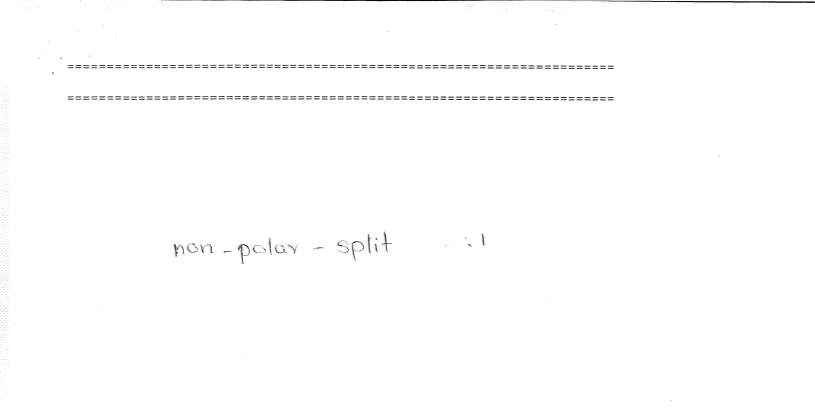
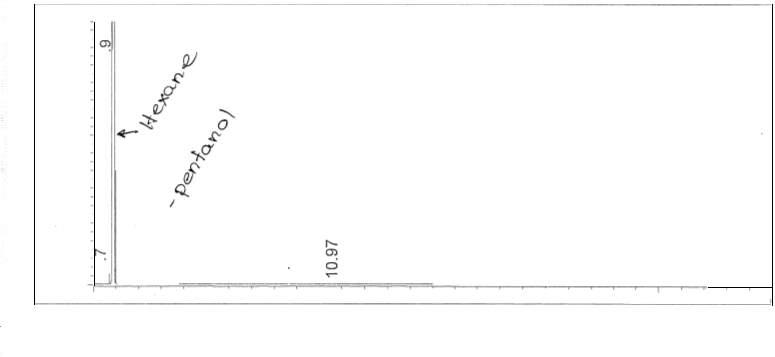
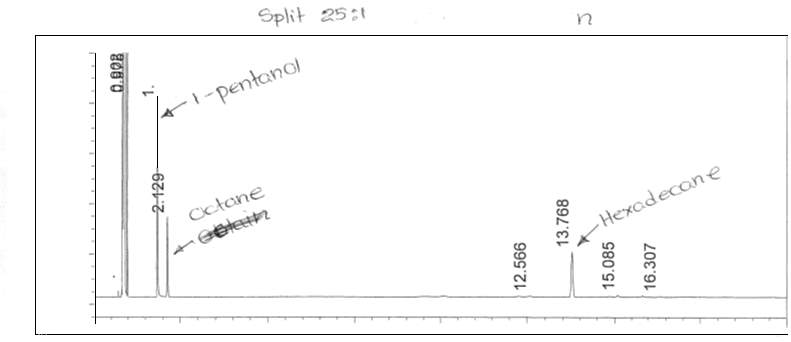
Figure 6: Non-polar split 25:1 Chromatogram of 1-pentanol
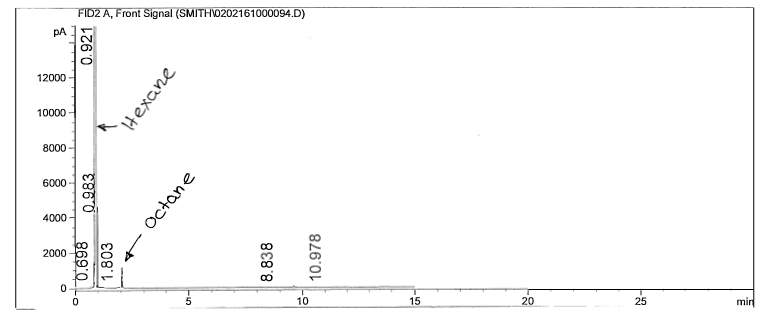
Figure 7: Non-polar split 25:1 Chromatogram of octane
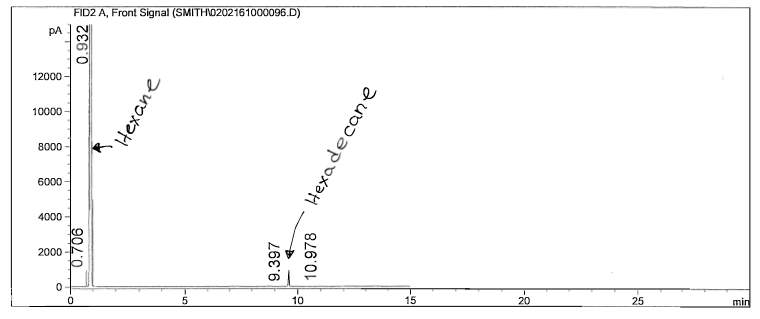
Figure 8: Non-polar split 25:1 Chromatogram of hexadecane
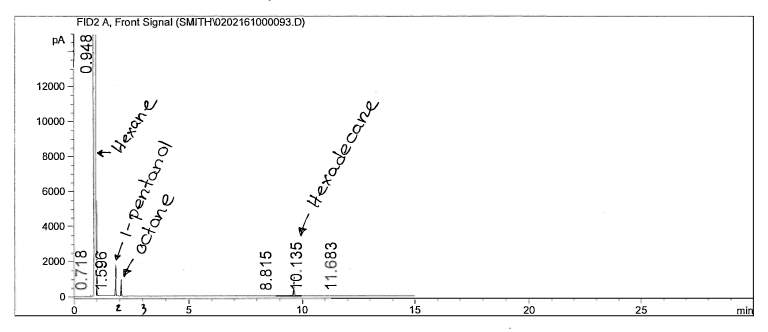 Figure 9: Non-polar split 25:1 Chromatogram of mixture
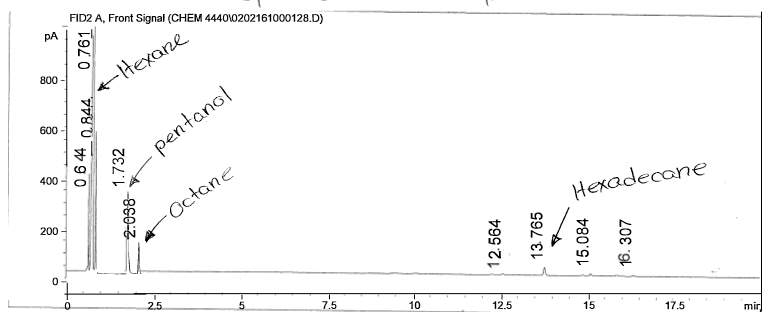
Figure 10: Non-polar split 30:1 Chromatogram
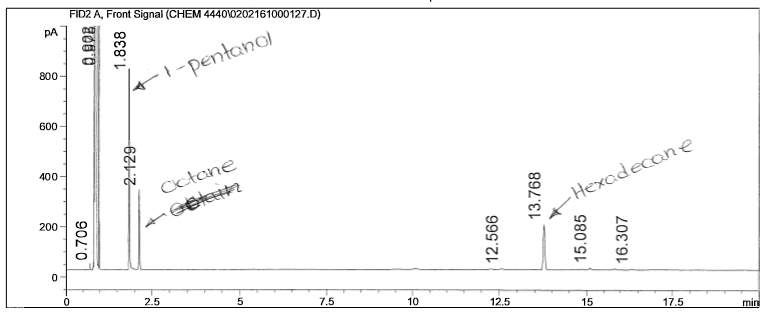
Figure 11: Non-polar split 25:1 Chromatogram of
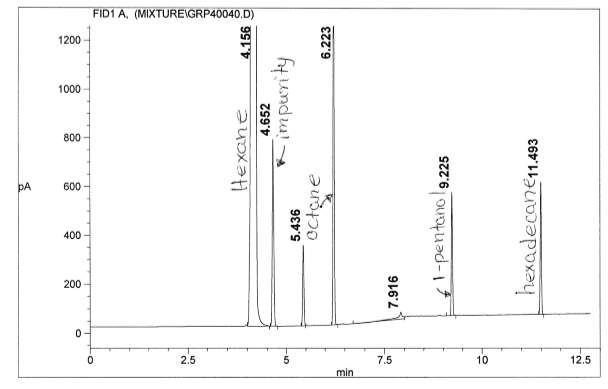
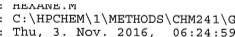
Figure 12: Polar Column Chromatogram of mixture
| C/min | Temp(C) | Hold Time (min) | |
| Initial temp | 30 | 2 | |
| Ramp 1 | 40 | 130 | 1 |
| Ramp 2 | 40 | 230 | 5 |
Table 1: Temperature Program for Figure 12
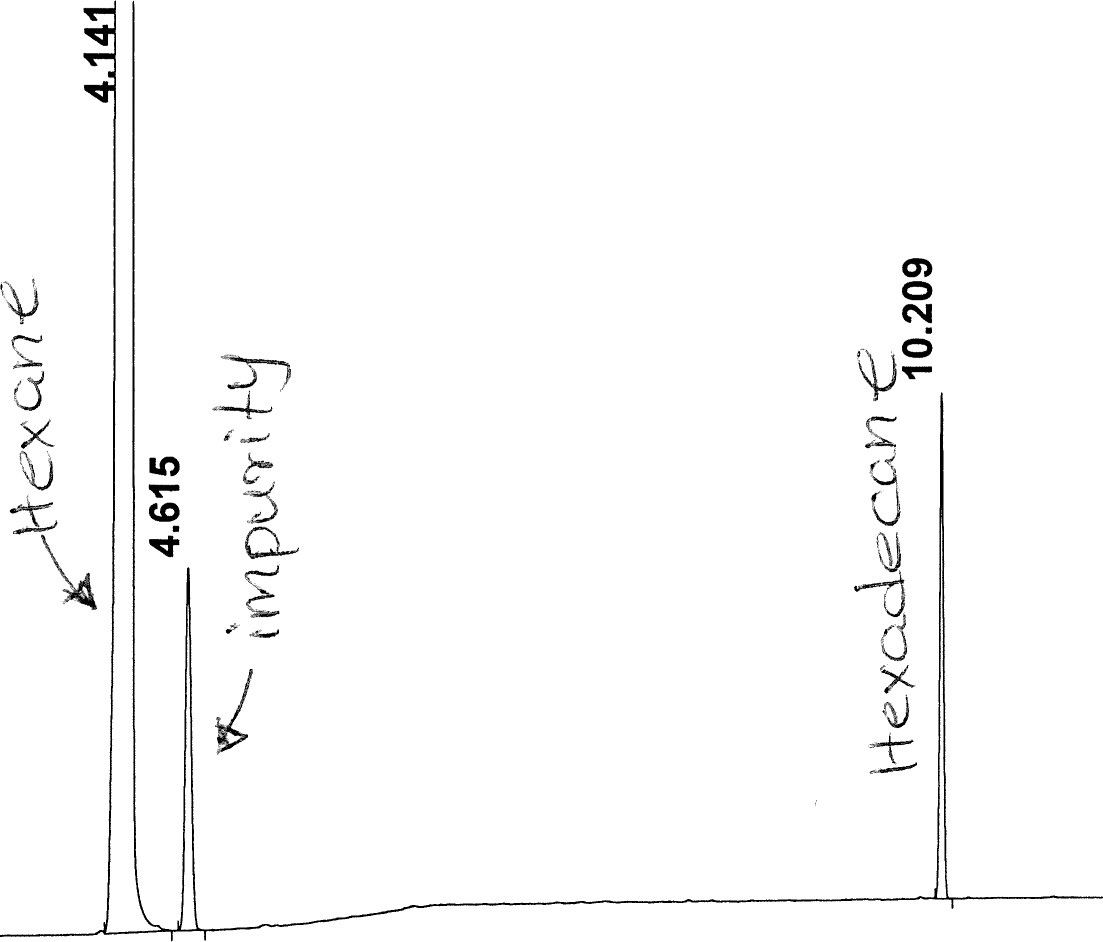
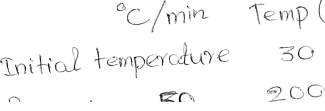
Figure 13: Polar Column Chromatogram of Hexadecane
| C/min | Temp(C) | Hold Time (min) | |
| Initial temp | 30 | 1 | |
| Ramp 1 | 50 | 200 | 0 |
| Ramp 2 | 30 | 230 | 5 |
Table 2: Temperature Program for figure 13
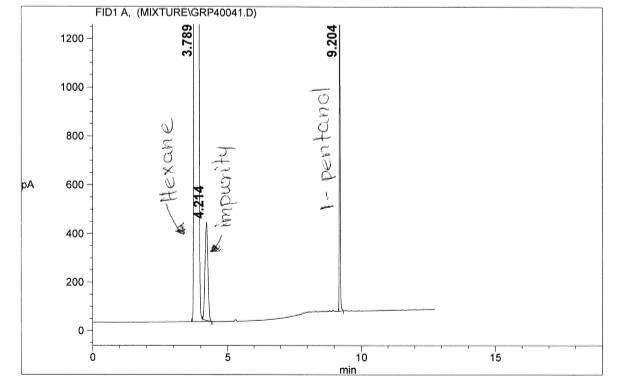
Figure 14: Figure 13: Polar Column Chromatogram of Pentanol
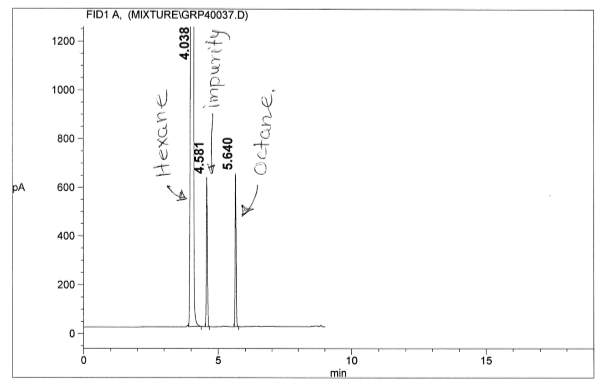
Figure 15: Figure 13: Polar Column Chromatogram of Octane
The calculations for one polar and non-polar chromatogram is shown in below in Table 3. The data in Table 3 is based on Figures 9 and 12; the plate height (HETP), plate number (N) and resolution was specifically calculated. In order to calculate the plate height (HETP or H) for each compound, the standard deviations were calculated first using the base peak width. To calculate the standard deviation (in minutes), Equation 4 was used.
| σt= Wt4 | (4) |
| σt Octane=.026 min4 = .0065 min |
Where
σtis the standard deviation found in units of time, and
Wt is the base peak width, also measured in units of time. Below eq. 4, an example of the standard deviation calculation is shown using the non-polar analytical column result of octane. The standard deviations for the chosen peaks were calculated in this fashion. Once the standard deviation was calculated, the plate heights were found using Equation 5.
| Hspatial= L* σt2tR2 | (5) | |
| Hspatial Octane=30 m* .00652 min2.0752 min=2.94* 10-4 m |
Where
Hspatialis the plate height, which is also known as the height equivalent to a theoretical plate (HETP). L is the length of the analytical column (both columns are 30 m),
σtis the standard deviation in units of time, and
tRis the retention time in units of time. Below eq. 5 is an example of the plate height for octane in the nonpolar analytical column. This equation was used for both compounds in each analytical column.
With the calculated plate heights, the number of theoretical plates were calculated using eq. 1. The compound, octane, was chosen to calculate this value for both analytical columns. An example of the N calculation is provided for the non-polar analytical column result of octane.
| NOctane= 30 m2.94* 10-4 m=102041 |
The separation between the two peaks, 1-pentanol and octane, were calculated using the resolution formula, given in Equation 6. The resolution was found for both chromatograms (Figures 9 and 12).
| RAB= tRB- tRAW= Peak SeparationAverage Peak Width | (6) |
| R= 2.075min- 1.828 min(.033 min+ .026 min)/2=8.37 |
Where
RABis the resolution between peaks A and B,
tRAand
tRBare the retention times of compound A and B, and W is the average peak width. Below eq. 6 is an example of the resolution calculation based on the non-polar analytical column; the polar analytical column was calculated in this same fashion.
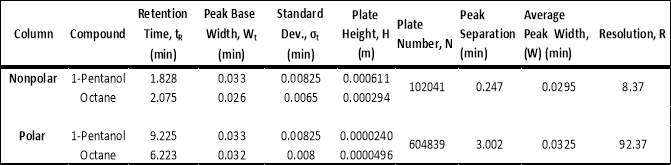 Table 3: Data of plate height, plate number and resolution amongst other data.
Split ratio was also calculated from figures 6 and 10. The split ratio was calculated using equation 7.
nonpolar split 25:1 and 30:125 to room and 1 to the column30 to room and 1 to the column (7)(126)(131)=Apentanol peak(F6)Apentanol peak(F10)
The areas of the peaks were collected from the attached appendix. The split ration was calculated to be:
0.0384615188540.0322580645=1724.954546.8201.192307694=3.15418854
Conclusion and Discussion of Uncertainty
The purpose of this experiment was to use a gas chromatograph with a flame ionization detector to determine the elution times and the amount of each nonpolar and polar compound of the sample. The goal of the experiment was to use a temperature program that was developed to determine the varying amount of each compound in the sample. In this experiment, the samples were run through a polar and nonpolar column. In the nonpolar column, the 1-pentanol came out first, followed by octane and hexadecane. For the polar column, the octane eluted first, which was followed by 1-pentanol and hexadecane. The split ratio is dependent on the ratio of gas flow through the column and the split line. With a larger split ratio, the peaks appeared to be shorter, narrower, but still sharp and efficient. The peaks that appeared in the chromatogram with a smaller split ratio were taller, broader and not as sharp.
Peak elution time differs under different conditions. For a longer initial time and same ramp and same final temperature, the compounds in the sample with elude within the same time period but the chromatogram would be shifted to the right. For a shorter initial time, same ramp, and same final temperature, the compounds in the sample will elude within the same time period as above, but instead of being shifted to the right, the chromatogram would be shifted to the left. For a temperature program with the same initial time and final temperature, but a faster ramp, the compounds in the sample will elude faster because of the faster rises in temperature. A temperature program with the same initial time and final temperature, but a slower ramp will allow the compounds to elude slower because of the slow rise in temperature. For a temperature program with same initial time and ramp, but a higher final temperature will allow many of the compounds to elude at the same time as stated above. Although, if the compound has a high boiling point close to the final temperature, that compound will elude slower because of the slower rise in temperature.
In any experiment that is conducted, there is always some uncertainty in the data collected and the method used. Another name for this would be experimental error. There are many things that may affect uncertainty, such as method error and instrument error. An uncertainty can occur when injecting the sample into the injector. If the sample is injected too fast or too slow, this may cause an unwanted peak in the chromatograph. An uncertainty can also occur in the syringe used to inject the sample. There may be pieces of rubber from the injector in the needle that is affecting how the syringe is used and how much the syringe is taking in and pushing out. Also, flooding the injector with sample can also be a cause of uncertainty. If the chromatograph is not started promptly after the sample has been injected, then the chromatogram could be affected. Uncertainty can also be caused if the gas flow rates to the flame ionization detector are not correct. The flow rate should be optimized for the instrument. Another uncertainty that can come from instrument error is that there is a leaky septum. A leak can cause pressure problems and lead to blockages.
There are many applications of the GC-FID. The GC-FID can be used in oil refinery to analyze the separate fractions of oil for petroleum products. The fractions can be used to divide the heavier aromatic and aliphatic fractions by carbon number. It can also be used to determine the purity of relatively pure solvents like xylene to liquors like scotch and drugs like cocaine. The GC-FID can run these samples through to determine if there are any contaminants in the sample and possibly what they are depending on their elution time. Another application where GC-FID would be used is in pharmaceutical manufacturing for the determination of residual solvents in the products. Pharmaceutical manufacturing uses the GC-FID to determine if there are any contaminants in their products, so that the medicine they create/make can be consumed.
Although gas chromatography has been proven to be highly efficient, it is not immune from error. The broadening of bands is a result of the time of interaction between the mobile phase and the stationary phase. The interaction time between the two phases relies on the flow rate of the mobile phase. The relation of the rate of the mobile phase and band broadening is explained by plate height, H. The mobile phase velocity is shown to be efficient when the plate height is low. This relationship is shown by the van Deemter plot, which plots the mobile phase velocity (cm/s) vs. plate height (cm). An expression that defines the columns efficiency is described by Equation 2.
| H=A+ Bu+ Csu+ Cmu | (2) |
Where H represents plate height, A is a coefficient that defines the effects of paths, B is the longitudinal diffusion coefficient, u is mobile phase velocity, Cs is the mass transfer coefficient for the stationary phase, and CM is the mass transfer coefficient for the mobile phase. The
equation illustrates linearly and inversely proportional terms in relation to the mobile phase velocity; also, the equation highlights the terms that are not dependent on mobile phase velocity. In gas phase chromatography, the column diameter is the important factor in determining the reduction of the broadening of the bands. A decrease in plate height is optimal for decreasing the zone broadening; this is accomplished by decreasing the longitudinal diffusion. The decrease in longitudinal diffusion can be accomplished by adjusting the temperature program, which should result in the decrease of temperature. This is specific for low velocity of the mobile phase. Changing the mobile phase velocity can have negative or positive effects. If you change the flow rate to be slower, the peaks will be more spread out. However, if you change the flow rate to be fast, the peaks will come out faster. This is not always a good thing. Sometimes, when the peaks come out too fast, the samples are not completely separating which defeats the purpose of the experiment. The Van Deemter equation is helpful in determining the perfect speed to run the samples.
Peak shapes are dependent on various properties, such as column capacity, temperature, flow rate and pressure. Peaks can become extremely broad if the capacity of the column has reached its maximum. These peaks are known as fronting peaks. This is due to the high amount of analyte molecules navigating through the column, which in turn may cause the elongation of elution time, resulting in broader peaks. Peak shapes can also be affected by aged column that may bring the analyte into contact with the binding sites of the column. This will also result in the elongation of elution time and possibly smaller peaks due to the analytes binding to the exposed binding sites of the column. These peaks that are caused from a sticky column are known as tailing peaks.


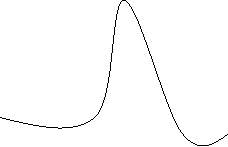
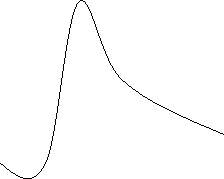
Figure C: Fronting Peaks Figure D: Tailing Peaks
The ability of the column to separate the two analytes is quantitatively defined by the resolution. More specifically, the resolution defines the distance of two bands relative to their widths. The mathematical relationship is given by Equation 3.
| Rs= ∆ZWa2+ Wb2 | (3) |
Where ∆Z is the distance between the peaks, Wa and Wb is width of the peaks. The resolution can be improved by lengthening the column. However, the number of plates will increase, which would result in the decrease of plate height.
The effects of boiling points and polarity is reflected by the results; retention times for the chosen non-polar analytical column resulted in smaller retention times compared to the chosen polar columns. The cause of such high variation in results, besides polarity, is most likely due to the difference in temperature parameters. Looking at the polar analytical column temperature program, the rate of the temperature increased at a higher amount than the non-polar column. Looking specifically at the non-polar analytical column, the retention time for 1-pentanol is slightly smaller than octane; because 1-pentanol is a non-polar compound, it did not have too much interaction with the stationary phase. The plate height, however, was larger than octane’s plate height; this could mean that the rate of the band spreading could be due to the polarity of the compound interacting with the stationary phase. The polar analytical column reveals that 1-pentanol has a longer retention time than octane; this is feasible due to the similarity of polarity of the stationary phase and 1-pentanol. Octane was faster in release due to its limited interaction with the stationary phase. Looking at the plate height for 1-pentanol, it is slightly smaller than octane; the meaning behind this is the fact that rate of spread is less due to the compatibility of polarity. The inverse relationship between plate height and plate number is shown; the plate height is incredibly small which in turn results in the plate number being quite high. Resolution is extremely high in the polar analytical column; the temperature program is most likely the cause.
Assigned Questions
- Why don’t compounds always elute in order of their boiling points in the GC?
Depending on what compounds and column, either polar or non-polar, are used the order of the compounds can be affected. A compound could have a lower boiling point but if it is a polar compound being run through a non-polar column there will be an interaction between the compound and the column slowing down the expected elution time.
- How does changing the length of the column effect the chromatogram?
If the column length if changed, the elution time will change. If the length of the column is shortened, then the elution time will be quicker because the sample does not have to travel as far to get to the detector. When the column length is elongated, the elution time will be slower because it is a further distance for the sample to travel through.
- How about the temperature program? How does increasing the rate of the temperature ramp effect the chromatogram? Be specific
When increasing the rate of the temperature program, the elution time of the different compounds will be affected. Depending on the rate/ °C set in the temperature program the amount of time for the mixture of compounds in the solution based on their boiling points and polarity will elute at different times. As the rate of the temperature ramp is increased the faster the compounds will elute on the chromatogram. This helps to save time when the compounds in the mixture have extreme differences in their boiling point by heating up the machine rapidly in order to reduce to time to reach the highest boiling point. However, this is can be a problem because if the compounds have similar boiling points their peaks could overlap in the chromatogram if the rate of increasing the temperature is to rapid.
- List two benefits and two drawbacks of the FID
One benefit of the FID is that any mobile phase impurities and carrier gases are not detected in the FID. This is beneficial because when looking at the chromatograph, there will be no confusion as to what peaks are from the sample and what peaks could be from the carrier gas or any impurities. One drawback of the FID would be that the FID is limited to molecules that are organic. Inorganic compounds do not respond well to the FID and can benefit from another type of detector. Although the FID is limited to organic molecules, a benefit of this is that the FID can measure the organic substance’s concentration at either very low or very high levels. The allows the FID to have a very large detection range. Another drawback is that the FID can actually be very destructive to the sample. This is very ineffective when the sample is needed back.
- The carrier gas velocity for our system was about 35 cm/sec. If efficiency is the chromatographer’s main concern, then why not simply increase the head pressure and therefore the flow rate and linear velocity of the mobile phase and speed up the chromatographic process?
Increasing the head pressure can be detrimental to elution peaks. The resolution will be quite low, indicating a poor separation, while the peaks will be broad.
References:
Skoog, D. A,; Holler, E.J.; Nieman T.A.; “Principles of Instrumental Analysis”, 6th ed.; Harcourt Base College Publishers: Philadelphia, 1998.
https://www.zoro.com/air-systems-international-high-pressure-regulator-rg-5000/i/G7456215/
Worksheets from David E. Thompson, SHSU
http://www.shsu.edu/~chm_tgc/GC/GCinject.html
King, B., & Westwood, S. (2001). GC–FID as a primary method for establishing the purity of organic CRMs used for drugs in sport analysis. Fresenius’ journal of analytical chemistry, 370(2), 194-199.
Nowak, T., Graffius, G. C., Liu, Y., Wu, N., Bu, X., Gong, X., … & Regalado, E. L. (2016). GC-FID method for high-throughput analysis of residual solvents in pharmaceutical drugs and intermediates. Green Chemistry, 18(13), 3732-3739.
Stepnowski, P., Siedlecka, E. M., Behrend, P., & Jastorff, B. (2002). Enhanced photo-degradation of contaminants in petroleum refinery wastewater. Water Research, 36(9), 2167-2172.
Appendix
*The files from doctor Thompson were converted into a word document and are included here in the appendix. *
Journal Summary
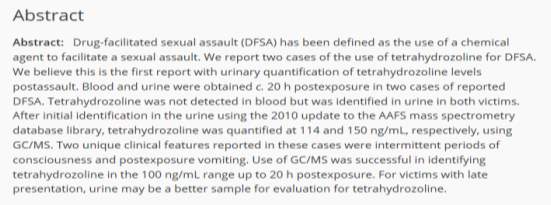
Unfortunately, sexual assault is a reoccurring crime in the United States. In about 44 percent of all sexual assault cases, a drug of some sort is used to impair the victim. The use of urinary quantification can help determine the amount/type of drugs used at the time of the assault after it has occurred. In this experiment, two cases were studied in order to determine the effectiveness of the GS/MS detection limits in victim’s urine. Following these two cases it was determined that the GC/MS can be effective in detecting amounts of drugs in urine up to 20 hours after the assault.
http://onlinelibrary.wiley.com.ezproxy.shsu.edu/doi/10.1111/j.1556-4029.2011.02026.x/full
Drug-Facilitated Sexual Assault Using Tetrahydrozoline
Authors: Henry A. Spiller M.S.,Dennis J. Siewert M.S.
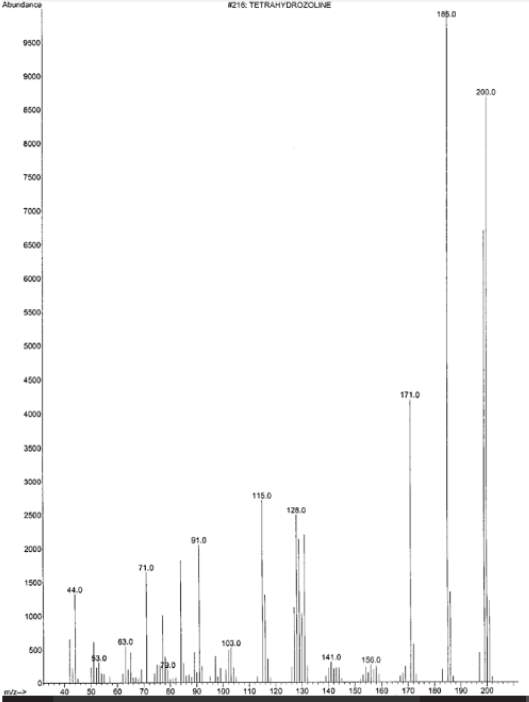
Figure E: from the journal summary
On 275 oc
On l7.282 psi
Total Flow On 133 mL/min
Septum Purge Flow On 3 mL/min

Gas Saver On 15 mL/min After 2 min
Split Ratio 25 :1
Split Flow 125 mL/min


Column #1
HP-5 5% Phenyl Methyl Siloxan: 604.67776
HP-5 5% Phenyl Methyl Siloxan
325 °C: 30 m x 320 µm x 0.25 µm
In: Front SS Inlet N2
| (Initial)
Pressure Flow Average Velocity Holdup Time Flow Program 5 mL/min for 5 min Run Time Front Detector FID Heater H2 Flow Air Flow Makeup Flow Const Col + Makeup Flame Electrometer |
40 °C
17.282 psi 5 mL/min 65.743 cm/sec 0.76054 min Off 15 min On 250 oc On 90 mL/min On 300 mL/min On 30 mL/min Off On On |


Out: Front Detector FID
7890A 10/28/2016 3:03:08 PM CHEM 4440 Mon GP23 Page 2 of 3
CHEM 4440 Simple Report Format DB-5 Nonpolar Column
 Data File name: C:CHEM32lDATASMITH ->
Method name: C:CHEM32lMETHODS4440 METH0DSTHA0_260CT16.M
cal 3
# Retention (pA*sec) Area Height Symmetr ——- ——-Width
———————————
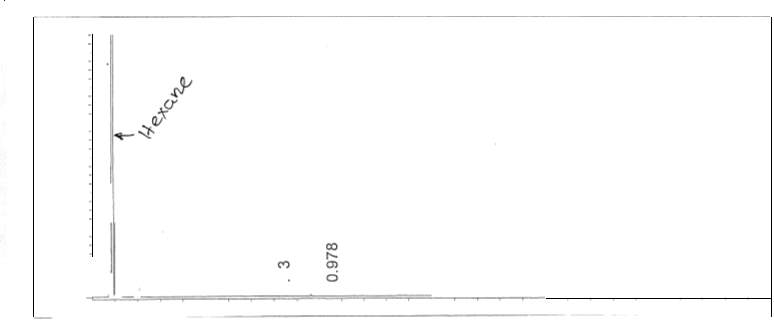
1 0.7 11 335.041 518.833 1 0.014
… 2 0.948 ######### 3.185e5 2 0.064
3 1.8 11 1724.954 1.0 35e3 1 0.027
4 8.835 22.314 3.227 2 0.0 93 5 9.622 12.043 4.4 9 9 1 0,042


 ————————————————6 1 0.978 12.367 4.230 1 0.045


created on:10/28/2016 2:32:48 PM
Page 1 of 1
Data File name: C:CHEM32lDATASMITH ->
Method name: C:CHEM32lMETHODS4440 METHODSTHA0_260CT16.M cal 3
# Retention Area Height ——-Symmetr Width


 ———————————(pA*sec) ——-
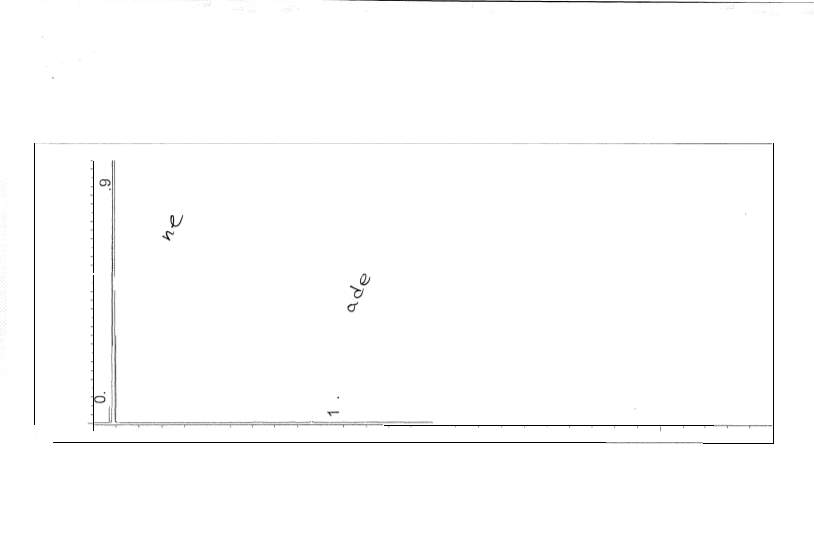
1 0.698 59.705 107.776 1 0.0 13
‘I’ 2 0.921 ######### 2.687e5 2 0.051
- 0.983 2795.718 3.980e3 1 0.012
- 1.803 75.156 4 0.990 1 0.028
‘II. 5 2.059 1717.025 l.092e3 1 0.028
- 8.838 9.075 2.927 1 0.047
- 9.623 225.681 92.527 1 0.040
———————————8 10.978 12.404 4.181 —————1 0.047


created on:10/28/2016 2:09:10 PM

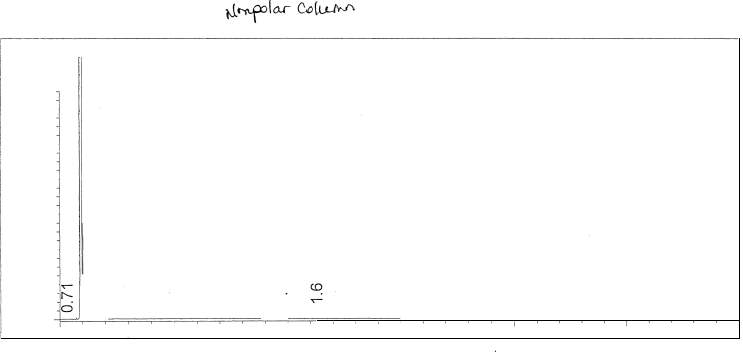
Page 1 of 1
- 0.706 432.165 802.073 1 0.013
- 0.932 ######### 2.765e5 2 0.055
- 9.397 8.368 3.406 1 0.038
- 9.63 0 2260.090 898.500 1 0.041


————————————————5 10.978 11. 020 3.784 1 0.045


created on:10/28/20 16 2:56:03 PM Page 1 of 1
Data File name: C:CHEM32lDATASMITH ->
Method name: C:CHEM32lMETHODS4440 METHODSTHA0_260CT16.M
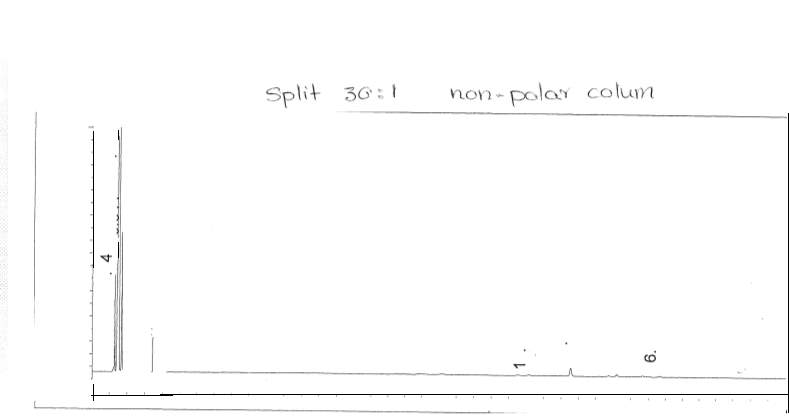
# Retention (pA*sec) Area Height Symmetr ——- Width—————————————
| 1 0. 718 40.516 78.750 | 1 0.012 |
| At 2 0.948 ######### 2.899e5 3 1. 596 8 .417 5.615 | 2 0.057
1 0.025 |
| ..r 4 1.828 3305.281 l.572e3 | 1 0.033 |
| •5 2.075 1443.949 927.956 | 1 0.026 |
| 6 8.815 67.776 9.515 | 3 0.099 |
| 7 9.399 11.5 00 4.152 | 1 0.044 |
| 8 9.635 2652.861 1.0 5le3 | 1 0.041 |
| t 9 10.135 8.269 2.803 | 1 0.046 |
| 10 10.976 31. 096 11. 492 1 0.044 | |


 ————————————————11 11. 683 12.793 4.410 1 0.045


created on:10/28/2016 1:47:00 PM

Page 1 of 1
method: C:CHEM321METHODS4440 METHODSGROUP2TR2-l.M
 Modified on: 11/3/2016 at 3:01:33 PM
Agilent 7890 GC

Oven
 Equilibration Time 0.5 min
Oven Program On
40 oc for 1 min
then 10 C/min to 100 cc for 1 min then 10 cc/min to 220 cc for 2 min
Run Time 22 min
Front Injector 


 Front SS Inlet N2
Mode Split Heater On 275 cc
Pressure On 17.282 psi
Total Flow On 158 mL/min
| Septum Purge Flow
Gas Saver Split Ratio Split Flow |
On 3 mL/min
On 15 mL/min After 2 min 30 : 1 150 mL/min |
Column #1
 HP-5 5% Phenyl Methyl Siloxan: 604.67776
HP-5 5% Phenyl Methyl Siloxan
325 °C: 30 m x 320 µm x 0.25 µm
In: Front SS Inlet N2
Out: Front Detector FID
(Initial) 40 °C
 Pressure 17.282 psi
Flow 5 mL/min Average Velocity 65.743 cm/sec
| Holdup Time
Flow Program 5 mL/min for 5 min Run Time Front Detector FID Heater H2 Flow Air Flow Makeup Flow Const Col + Makeup Flame Electrometer |
0.76054 min Off | ||
| 22 min
On 250 oc On 90 mL/min On 300 mL/min On 30 mL/min Off On On |
|||
| 7890A 11/3/2016 3:02:07 PM Group three | Page | 1 of 2 | |

# Retention (pA*sec) Area Height Symmetr ——- Width——-
———————————
- 0.644 320.547 326.494 1 0.018
- 0.761 ######### 8.23le4 1 0.027
- 0.844 513.143 518.139 1 0.020 4 1.732 546.820 322.654 1 0.028
- 2.038 237.106 123.436 1 0.032
- 12.564 15.690 3.316 1 0.073
- 13.765 113.658 31.9 22 1 0.058 8 15.084 39.045 7.510 2 0.077
9 15.823 18.222 4.599 1 0.062


 ——————————–10 16.307 15.243 3.762 —————-1 0.062
created on:11/3/2016 3:01:31 PM
Page 1 of 1
Modified on: 11/3/2016 at 2:19:16 PM method: C:CHEM32lMETHODS4440 METHODSGROUP2TR2.M
 ===================== ·===============================================Agilent 7890 GC ============================—–==—–=-===========================
Oven Oven Program Equilibration 40 oc 1010for C/min to C/min to Time 220 0.5On min
1 min 100


 Run then then Time oc oc for for 21 min min 22 min

| Front Injector
Mode Front SS Inlet N2 Heater Pressure Total Flow Septum Purge Flow Gas Saver Split Flow Split Ratio |
Split On On On On On 27517.282133153 mL/min mL/min After 2 min mL/min °C psi lQmin |

Column #1 HP-5 In: Front SS Inlet N2 HP-5 325 °C: 55% Phenyl Methyl Siloxan: % Phenyl Methyl Siloxan 30 m x 320 µm x 0.25 µm 604.67776
Out: Front Detector FID
Pressure (Initial)
| Run Time 5 mL/min for 5 min
Air Flow Heater H2 Flow Front Detector FID Const Col+ Makeup Flow Flame Makeup Electrometer |
22 min
On On On 2503090300 mL/min mL/min mL/min oc Off On On On |
|
Average Velocity Flow Holdup Time Flow Program 17.2820.7605465.743Off 405 cm/sec °C mL/min psi min

7890A 11/3/2016 2:35:02 PM Group three Page 1 of 2
 CHEM 4440 Simple Report Format DB-5 Nonpolar Column
Data File name: C:CHEM32lDATACHEM 4440 ->
Method name: C:CHEM32lMETHODS4440 METHODSGROUP2TR2.M
# Retention (pA*sec) Area Height Sy——-mmetr Width ——-
———————————
1 0.706 11.114 18.827 1 0.013 2 0.902  ######### l.644e5 1 0.031 3 0.975 1089.672 l.584e3 1 0.014 4 1.838 1245.044 772.105 1 0.027 5 2.129 556.642 313.962 1 0.030
- 12.566 15.609 3.412 1 0.071
- 13.768 628.071 176.828 1 0.056
- 15.085 39.439 7.607 2 0.076
- 15.823 18.350 4.563 1 0.063


————————————————10 16.307 15.067 3.740 1 0.061
created on:11/3/2016 2:23:47 PM

Page 1 of 1
C :  0040 . D mixture

 mixture 1
  Jan 1
Jan 1

 GR2TR2 – 1
 Thu, 3 . Nov. 2016, pm pcsay
(modified after loading) to run hydrocarbon standards and unknowns in CHM241, Spring

2008 .
| 1200
1000 800 600 400
200
|
FIDI A, (MIXTUREGRP40040.D)
|
| 0 2.5 5 7.5 10 12.5 min |


# Meas . R T Width Area Height Area %

 4 . 156 VB S 0 . 069 6 . 675e5 1.560e5 98 . 737 TempevcGesYe
- 4 . 652
 2 .135e3 763 . 633 0 . 316
 - 5 . 4360 . 035 740 . 114 329 . 356 0 . 109
- 6 . 2230 . 032 3 .234e3 1.550e3 0 . 478
- 7 . 916 PV 0 . 115 257 . 691 27 . 982 0 . 038
- 9 . 225
 0 . 033 1 . 063e3 504 . 883 0 . 157
| 7 | 11 . 493 |  |
0 . 032
|
1. 106e3 | 542 . 626 | 0 . 164 | 
|
30 | 2 |


 2
2Instrument  1 of
1 of

Hexadecane
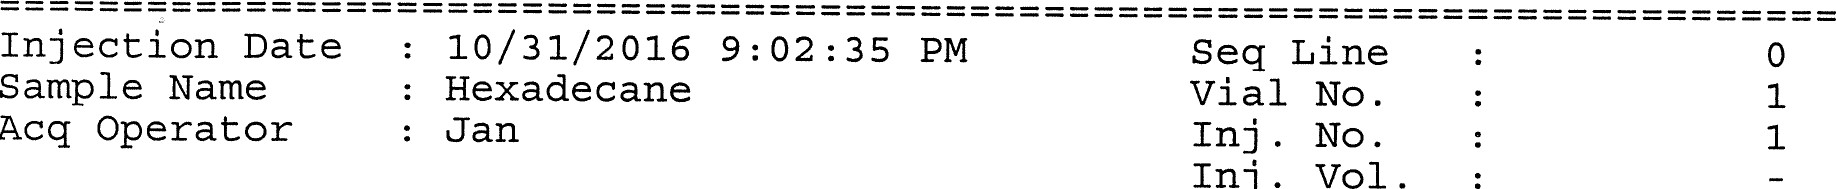
 Thu, 3. Nov. 2016,
(modified after loading) to run hydrocarbon standards and unknowns in CHM241, Spring
2008 .
| 1200
1000 800 600 400 200
0 |
FIDI A, (MIXTUREGRP40038.D)
|
| 0 2 4 6 8 10 min |


# Meas. R Peak T Width Area Height Area %

- 4 . 141 VB S 0 . 056 4.340e5 1.236e5 99 . 380
- 4 . 615
 0 . 047 1.451e3 477 . 319 0 . 332
 - 10 . 209
 0 . 030 1.258e3 666 . 054 0 . 288

Tempeycx:vucy e  cou
cou

 Rump
Rump

Instrument  1 of C :
  0 041 . D pentanol

 0
0
 1
1  . 1 .
. 1 . 
 GR2 TR2 – 1
Thu, 3 . Nov. pm p ocs
Cite This Work
To export a reference to this article please select a referencing stye below:
Related Services
View all


Related Content
All TagsContent relating to: "Chemistry"
Chemistry is a science involving the study of the elements and matter at the atomic and molecular level including their composition, structure, properties, behaviour, and how they react or combine.
Related Articles

DMCA / Removal Request
If you are the original writer of this dissertation and no longer wish to have your work published on the UKDiss.com website then please: