Analytics on Risk Factors related to Non-communicable Diseases
Info: 15979 words (64 pages) Dissertation
Published: 9th Dec 2019
Tagged: Health and Social CareMedicine
ABSTRACT
Non-Communicable diseases (NCDs) is a major global problem which includes diseases like cancer, heart diseases which will report to death. The healthy lifestyle habits should be maintained to get rid of these diseases. Balanced nutritional diet and physical activity keeps the individual healthy. This reduces stress and the probability of having disease. This handles large amount of data and helps so as to get proper medication on time.
The research work aims to estimate the common risk factors for NCDs among the population. This will help the common people who are not aware about the risk factors for NCD which undergone various parameters like obesity, vigorous work, smoking and high blood pressure and many more. Existing project focus on the urban area and algorithm used is able to predict only for diabetes other diseases are not covered. In this data from the rural area has taken where people are less educated about such diseases. This unstructured data will be pre-processed to produce structured dataset. This will predict the disease on basis of some lifestyle habits.
The structured data after pre-processing from apache spark is used to store it in database on which analytics will be performed. The prediction of the disease on the basis of lifestyle habits is done by machine learning algorithm that is decision tree. The analytical result will be represented on the dashboards. Following conditions are kept on lifestyle habits to predict the particular disease.
The data processing and data preparation is done using apache spark. To predict the disease decision tree machine learning algorithm is used using ML Library of apache spark. This uses python as language. The visualization framework for displaying dashboards and represent the analytical result uses Angular JS for client side framework and Scala for server side framework. The charting is done using Dev extreme.
ii
INTRODUCTION
This is almost a famous definition about big data “Big data is a situation in which data sets have increased at a huge size and defined technology and tools cannot handle the growth of data set”. Every moment a large amount of data is converted to the electronic records. Handling huge amount of data needs proper tools and technology. Big Data and analysis of the big data cannot be separated. Big Data not only refers to overloading of the data but needs analytical tools to manage the flow of data.
The term analysing the medical record and predictive analysis used to manage large datasets to exceed its ability to retrieve future knowledge which will be helpful in various fields especially in health care. This defines the significance of big data in prediction of non-communicable diseases and its risk factors. Big data in healthcare is concerned with meaningful datasets to derive appropriate information which is challenging when data is too big, too fast complex for the providers to perform processing and interpret the result with the existing tools.
Data is a backbone of any healthcare industry and storing the data, data extraction and utilizing the data is the key practice taken to provide necessary information. This field has powerful impact on the healthcare industry as well on the providers which help them to take better decisions for the prediction of the diseases. This change lead to a potential revolutionary change is the industry. The amount of data collected is drastically large.
The models which are already present which are used for disease predictive analysis as well as personalized record management system are not that efficient and such tools will encounter certain problems soon as data is increasing and need to be handled in desired and proper manner. The problem also occurs when computational time of these system get worse and will not able to function in a required timeframe. Such systems cannot be used for the clinical practices.
The emerging epidemics for non-communicable diseases can be used for analysing the social, political, behavioural and economic determinants. Analytics can monitor, prevent and control the non-communicable disease this reduces the exposure level of the individual and a group towards common risk factors for NCD. The factors like use of tobacco, alcohol use , physical and unhealthy diet are the harmful cause , while after reduction and change of lifestyle habits 1
it can provide strength to the population. The changes are done to foster the good health.
1.1 BACKGROUND OF STUDY
Non-Communicable diseases (NCDs) is a major global problem which includes diseases like cancer, heart diseases which will report to death. This defines diseases which will last for long may be years or lifetime. There no such factors involved which can lead to transmit disease from one individual to another. With rapid industrialization and increase in modernization the lifestyle habits are changing which make to pay a lot amount of money on such diseases. These are also referred to as “Chronic” or “Lifestyle Disease”. The WHO developed a step approach to bring about some homogeneity in the data collected with respect to NCDs all over the world and make a better sense of various surveys. By 2025, India will have the most elevated incidence of diabetes and heart disease in the world, and cardiovascular diseases will be the main reason for death and disability in India
NCD represent a huge group of disease which includes diabetes, cancers and cardiovascular disease (CVD). The prevalence of the risk and significance of NCD results in complex interaction between economical, health and development. The tremendous growth of disease affects social welfare. This also causes decreased productivity at the workplace. The major cause of the NCD is due to four behavioural risk factors, modern lifestyle, tobacco consumption, alcohol consumption, unhealthy diet and less physical activity. These factors are interconnected to each other in such a way that leads to the development of noncommunicable disease. NCD need continuous assessment and care for disease, financial and human resources.
The healthy lifestyle habits should be maintained to get rid of these diseases. Balanced nutritional diet and physical activity keeps the individual healthy. This reduces stress and the probability of having disease. This handles large amount of data and helps so as to get proper medication on time. This will predict the disease on basis of some lifestyle habits.
The dataset contains lifestyle habits of the rural people which can be used for predictive analysis of the disease. Non-communicable disease is a major threat to the public health which affects the economic stability and mental stability. Monitoring the data and keeping track of the symptoms related to the disease will help to predict the disease based on the historical data as well which will help the doctors in better decision making. In the recent years the prevalence of non- Communicable disease is rising rapidly.
The major cause of this is the wellbeing harming practices, for example, smoking, drinking, undesirable eating regimen, hereditary abnormalities, heredity, and way of life or environment can add to high weight of NCDs. The population belongs to rural area are most prone to the risks of NCDs as their lifestyle habits may cause the risk of having the disease.
1.2 PROBLEM STATEMENT
The threat of non-communicable disease needs to be monitored and its prevalence effectively in the rural area of the Bhopal. Individual knowledge about having the disease due to the various lifestyles habit is most important. The system is made to predict the disease based on lifestyle habits. This will help the common the people who are not aware about the risk factors for NCDs undergone by various parameters.
Data from the rural area has been taken where people are less educated about such diseases. The analytics on the data will help to predict the kind of disease and on the basis of analytics an alert signal will be generated notifying risk for the disease.
1.3 AIM OF THE STUDY
This project aims to estimate the common risk factors for NCDs among the population. Non- Communicable diseases (NCDs) are a major global problem. This will help the common the people who are not aware about the risk factors for NCDs undergone by various parameters. Data from the rural area has been taken where people are less educated about such diseases. The analytics on the data will help to predict the kind of disease and on the basis of analytics an alert signal will be generated notifying risk for the disease.
The purpose of this project is to determine the risk factors for non-communicable diseases among men and women age between 25 and 60 above lining in rural area of Bhopal. The various lifestyles habits like blood pressure, physical activity, tobacco and its product consumption, alcohol intake and other dietary habits helps to perform analytics over it . These parameters helps in predicting the disease like cancer, diabetes.
1.4 OBJECTIVE
- To predict the risk of having a disease based on the collected data.
- To predict the disease which a person can have based on the parameter.
- To determine the prevalence of health risk behaviors such as smoking, risky alcohol consumption and physical inactivity.
- To suggest recommendation based on the study findings.
1.4 THESIS ORGANIZATION
The chapter begins elaborating the big data and its use in healthcare industry. The factors used for predicting the non-communicable disease. Initial chapter talk about why and how to use big data and its technology predict and help the people of the rural area.
Chapter 2 takes a look to the existing work carried out by the researchers the pros and cons in that research. This helps to find the problem in a better way. This includes hardware and software used by them.
Chapter 3 presents the detailed design of the system that includes system architecture, ERdiagram and other necessary diagrams.
Chapter 4 this explains the implementation of methodology, justification of the selected tools and technology.
Chapter 5 this technical section contains result, parameter used for study, performance metrics, comparisons and analytical results.
LITERATURE SURVEY
This literature review presents many results on prediction of the disease carried out by different methods and problems in determining materials of disease. Different prediction model has been proposed which uses data mining to predict diabetes. Different combinations machine learning algorithms are used for handling the missing values.
Saravana Kumar et al [1] proposed an algorithm for predictive analysis. Hadoop and Map Reduce environment is used to predict the diabetes type’s prevalence and complications associated with it and type of treatment to be provided. This uses predictive pattern mapping and process the analysed reports. It uses association rule mining. This research focus on the diabetes alone and cannot be used for predicting other disease.
Mimoh Ojha et al [2] proposed a big data analytics method and technology. Open Refine, Hadoop and google analytics is used at M.Y hospital which helps to predict and transform people healthcare by gaining insight knowledge for taking clinical decisions. Converting paper work completely digitalized. But data analysis can help to run system more efficiently.
M Archana Bakare et al [3] proposed a method which aims to provide analysis of data results and used for predicting diabetes and low/ high blood pressure using k- means algorithm [3]. The data set from the twitter is used where cleaning of data is done then k-means algorithm is applied which is used for the classification of the data. The result is analysed and predicted.
Kiran J Waghmare et al [4] takes relevant datasets of the employees and proposes a method which will help in predicting disease pattern and clinical decision making to reduce prevalence of NCD’s in working population. The clustering and k-means algorithm [4] is used for prediction. The dataset of the employees in public sector is collected. Clustering is done as data mining technique. K-means algorithm and Euclidean distance is calculated for data analysis.
Sudha Ram et al [5] proposes a delicate processing based expectation model used for finding the dangers aggregated by the diabetic patients. They have explored different avenues regarding continuous clinical information utilizing Genetic Algorithm.
Wullianallur Raghupathi et al [6] proposes a method to acquire outcomes which relates the level of hazard inclined to either heart assault or stroke. A crossover mix of Classification and Relapse Trees (CART) and Genetic Algorithms to ascribe missing nonstop values and Self Organizing Feature Maps (SOFM) to credit indefinite values was enhanced.
Muni Kumar et al [7] in 2014 said achieving better outcomes at low cost is important for health care and which is achieved through the implementation of Hadoop HDFS / Map Reduce to uncover the information lying in big health data sets. It proposes seven new ideas for the rural health e-health file, chronic disease awareness, e-prescription, e- medical record management, stopping treatment for unnecessary things, infant mortality reduction, tele- medicine.
Andrew Pearson et at [8] presents the prescient investigation works in three ranges, for example, Operations administration, Medical administration and biomedicine, and System outline and arranging. Human services prescient examination framework can help issues that can address the cost of patients being over and over conceded and readmitted to a clinic for endless infections which is comparative or different.
Andrew Kusiak et al [9] used data cleaning, data pre-processing, data transformation and data mining to identify the meaningful knowledge from the interaction of various measured parameters. The decision rules are obtained from two different data mining algorithms which are used for extracting the meaningful information. Decision making algorithm is used to predict the survival of unseen patient by using the defined rules. The research work and data collection is carried out at four dialysis site. The priority can be given to patients based on the predicted result.
RovinaDbritto et al[10] used classification method for prediction .It mainly compares four algorithm Decision Tree, Naive Bayes, Support Vector Machine and K- means. The prediction is done by passing the large dataset to the decision tree as well as Naive Bayes algorithm. For prediction Logistic Regression is used.
Lemke F et al [11] proposed the method in which data mining techniques are used for medical analysis of the records. The medical record, problems and procedure is analyzed using a decision tree. The collection of the large record of data is a major drawback occurred while working
The review of New England, Journal of Medicine tells that one in five patients experience the ill effects of preventable readmissions. Therefore, 1% of the populace represents 20% of all US medicinal services uses nearly and 25% for more than 80% of all consumptions. The above researchers have been successful in determining the diabetic data set but still, other non-communicable diseases are not predicted.
They have developed good prediction model. In our research work, we use the predictive analysis technique with the big data analysis and machine learning algorithm to predict and classify the different diseases. This system provides efficient solution for curing the patients at lower cost with better result.
SYSTEM DESIGN
The system design document provides a deep insight knowledge of the proposed system in terms of system architecture, database design, hardware and software information, processing logic and external interface.
3.1 PROPOSED SYSTEM
The proposed system is used to predict the prevalence of non-communicable disease among the individuals from the rural area. The aspects with respect to non-communicable disease can last for year or lifetime also. To reduce this a proper survey is conducted to collect the data of the individuals from the rural area of Bhopal which focus on the lifestyle of the humans. Educating the rural area people about the aspect of the disease that how their lifestyle is affecting their health. But this alone is not helpful we need to find that how many of them are prone to disease for this purpose a system is proposed that help predict disease on the basis of lifestyle habits, like tobacco and alcohol consumption, dietary habits and other such parameters.
This system is helpful for the common people who are not aware of risks that can happen by following such lifestyle. So that to take preventive measures they can transform their lifestyle accordingly. The analytics on the data will help to predict the kind of disease and on the basis of analytics, an alert signal will be generated notifying risk for the disease.
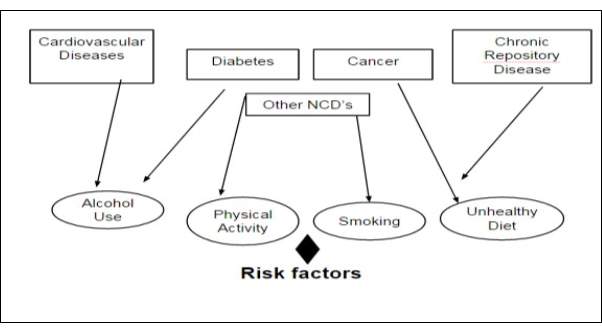
Fig-3.1 Risk Factors for Diseases
3.1.1 AIM & SCOPE
This project aims to estimate the common risk factors for NCDs among the population. Non- Communicable diseases (NCDs) are a major global problem. This will help the common the people who are not aware of the risk factors for NCDs undergone by various parameters. Data from the rural area has been taken where people are less educated about such diseases. The analytics on the data will help to predict the kind of disease and on the basis of analytics, an alert signal will be generated notifying risk for the disease.
The emerging epidemics for non-communicable diseases can be used for analyzing the social, political, behavioral and economic determinants. Analytics can monitor, prevent and control the non-communicable disease this reduces the exposure level of the individual and a group towards common risk factors for NCD. The factors like use of tobacco, alcohol use, physical and unhealthy diet are the harmful cause, while after reduction and change of lifestyle habits it can provide strength to the population. The changes are done to foster the good health.
The purpose of this project is to determine the risk factors for non-communicable diseases among men and women age between 25 and 60 above living in rural area of Bhopal. The various lifestyles habits like blood pressure, physical activity, tobacco and its product consumption, alcohol intake and other dietary habits help to perform analytics on it. These parameters help in predicting the disease like cancer, diabetes.
This will predict the risk of having a disease based on the collected data. It also tells which person has disease based on the parameters. It determines the prevalence of health risk behaviours such as smoking, alcohol consumption and physical activity. With this appropriate suggestions and recommendations can be giving from study findings. This will help to reduce the non-communicable diseases by at least 50% from the rural area. As a practice if they will be provided with proper guidance about the change in lifestyle habits can minimize the risk of having NCDs.
3.1.2 FEATURES
The system provides features for predicting the risk of having a disease. On the basis of collected data various parameters are obtained from the questionnaire which is used for prediction of the disease.
The major cause of the NCD is due to four behavioral risk factors, modern lifestyle, tobacco consumption, alcohol consumption, unhealthy diet and less physical activity. These factors are interconnected to each other in such a way that leads to the development of a noncommunicable disease. These are the following features:
- To predict the risk of having a disease based on the collected data.
- To predict the disease which a person can have based on the parameter.
- To generate an alert signal to notify risk for the disease.
- To suggest recommendation based on the study findings.
This project determines the risk for non-communicable disease among men and women of different age groups in the rural area of Bhopal. The various lifestyles habits like blood pressure, physical activity, tobacco and its product consumption, alcohol intake and other dietary habits help to perform analytics on it. These parameters help in predicting the disease like cancer, diabetes.
This addresses the issue that rural area people are less educated and they are not exposed to the regular treatment. By the analysis of the various parameter and there daily food consumption habits the prediction of risk for the disease can be done. The problem faced by patients and specialists and can also provide a solution to these issues. It also discusses h o w the big data analytics can transform people’s healthcare by gaining insight for making clinical decisions.
3.1.3 ADVANTAGE AND DISADVANTAGE
This system is helpful for the common people who are not aware of risks that can happen by following such lifestyle. So that to take preventive measures they can transform their lifestyle accordingly.
- As rural area people are less educated about these diseases, with the help of this system they can analyze their lifestyle habits.
- This can predict the disease based on the various parameters like alcohol and tobacco product consumption.
- This helps the people to recommend them to the specialist according to the finding.
- The various diseases like cancer, hypertension, and diabetes can be identified according to the parameters.
- It helps doctors and other clinical members to take better decision from the background knowledge and from the information gained after prediction
3.2 SYSTEM ARCHITECTURE
The architecture for the predictive analysis of non-communicable disease includes various steps of the pipeline like data collection, data cleaning, data processing, predictive analysis, processing analyzed reports.
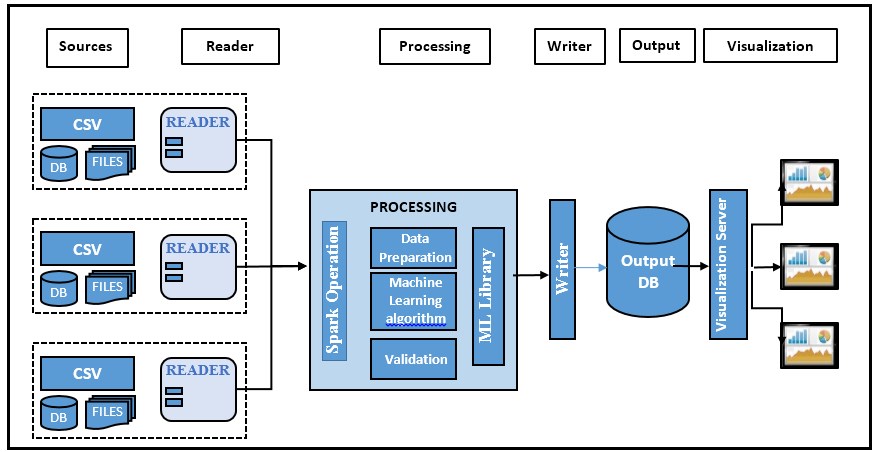
Fig-3.2 Architecture Overview
The architecture of the project shows various phases. The source will supply input to the reader, the input will be in the form of csv format. The reader will read the data or the reads the text input format from the source and will be taken for processing. Data processing is done for the reader output which contains data preparation that needs to clean the data and finding out the missing value, filtering meaningful data and mean normalization. After the data is divided into meaningful data frames it is passed to the machine learning algorithm where the classification and prediction are done using decision tree algorithm. Validation or correctness of the predicted data will be done using overfitting and under fitting which is done by k-fold cross validation. The output is saved as CSV format and will be stored in the database. The stored data is queried to take out the meaningful information that can be represented in the form of charts. The charting is done by the visualization framework which fetches the data from the rest API and displays the charts using Dev extreme
This consist of following phases:
- Data Collection: The data collection is done based on the questionnaire which contains questions related to the lifestyle of the individual in the rural area of Bhopal.
- Reader: It is a record reader which reads the text input format. The text input format is in the csv format.
- Data Processing : Data processing consists of following steps:
- Data preparation : This includes cleaning of data, formatting the data according to the requirement, take care of the missing values, joining data set if required, filtration of the relevant data and mean normalization is carried out to get the meaningful data.
- Machine Learning Algorithm: This is used for the prediction of the disease based on the certain parameters. The decision tree algorithm is used to predict the disease. First, the data is divided into training and test data set which is passed to the machine learning library to predict the disease based on the conditions of the parameter.
- Validation: For validation both over fitting and under fitting need to be done. K- Fold cross validation will be used to minimize the noise while testing the fitness of the data
- Overfitting: As Predictor is too flexible it fits noise in the training data. This can find another predictor which makes more mistake on training data Etrain(F’)>Etrain(F) but few mistakes are unseen on future data Egen (F’)<Egen(F).
- Underfitting: Predictor is too simple. This is not enough powerful to capture the salient patterns in data.
- Output Format: The data can be saved as CSV and text file. This output will be used to displaying various dashboards. The data will be stored in the database and queried to get the meaningful information which can be presented in the form of dashboards.
- Visualization: The visualization framework is used for displaying the data in form of dashboards from the Dev extreme library. The data from the rest API is fetched where the data is queried on the database and is passed as the data source to the client to represent I
on the dashboard.
3.3 DETAILED DESIGN
LOW-LEVEL DESIGN
The Low level design is used for the design of data structure. It is a component level step by step process for the refinement of the process. This gives the internal logic and detailed design of the component.
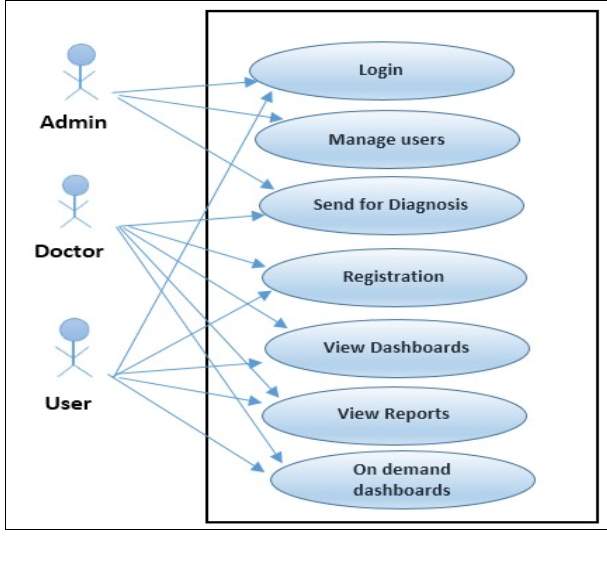
3.3.1 USE-CASE DIAGRAM
Use Case diagram represents the actions carried out by the system. It explains the working of the overall system.
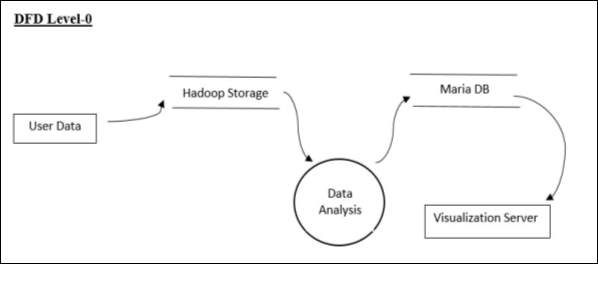
3.3.2 DATA FLOW DIAGRAM
DFD Level-0
DFD Level-0 represents the high-level design where the data is stored in the system and which data analytics is performed. The output of the analytics will be stored in the database that will be passed to the visualization server which represents it in the form of dashboards.
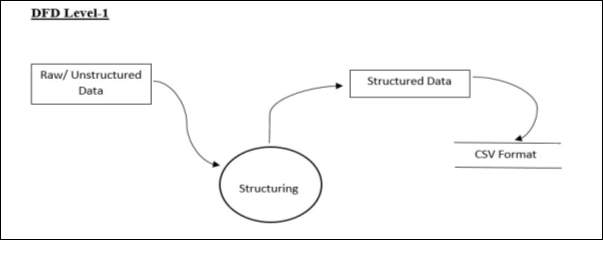
DFD Level-1
DFD Level 1 represents the structuring of the user data. The raw data is structured into a csv format which will be given as input to the system.
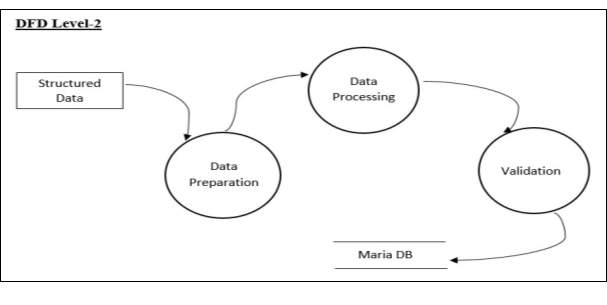
DFD Level-2
Structured data is passed to the data preparation where cleaning of data is done, taking care of missing values and will make data set in a format which is needed to be processed by data processing. After data processing, the validation will be carried out to check the validity of the data. This data will be stored in the database and will be carried out further.
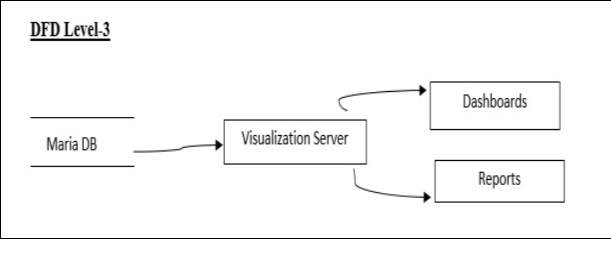
DFD Level-3
The data from the database will be passed to the visualization server which contains client and server that is used to display the dashboards and reports.
3.3.3 ER- DIAGRAM
The entity relationship diagram is used to represent the relationship between different entities that are stored in database and its attribute.
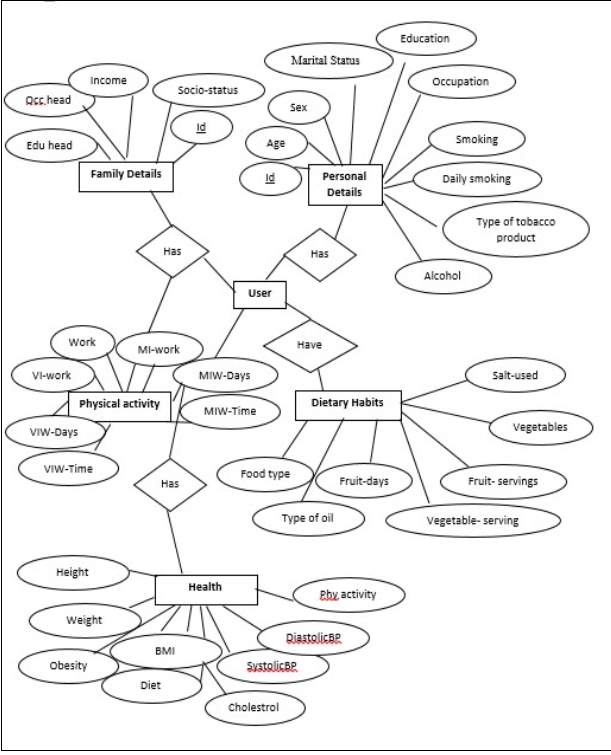
Fig 3.7 ER-Diagram
3.3.4 TABLE STRUCTURE
1. tbl_personalDetails
Personal Details enables to store the personal details of the user which can be used for analysis.
| Field Name | Constraints | Purpose |
| Id | Not null | Id |
| Age | Null | Age group |
| Sex | Null | Sex |
| Marital Status | Null | Marital status |
| Education | Null | Educated or not |
| Occupation | Null | Type of occupation |
| Smoking | Null | Smoke-Yes/No |
| Daily_Smoking | Null | Daily habits |
| Alcohol | Null | Alcohol-Yes/No |
| Type_of_tobacoo_product | Null | Tobacco product consumption |
Table – 3.1 Personal Details 2. tbl_familyDetails
Family Details enables to store the details of the family of the user which can be used for analysis.
| Field Name | Constraints | Purpose |
| Id | Not null | Id |
| Edu_head | Null | Education head of the family |
| Occ_head | Null | Occupation head of the family |
| Income | Null | Family income |
| Socio-status | Null | Social status |
Table 3.2- Family Details 3. tbl_DietryHabits
Family Details enables to store the details of the family of the user which can be used for analysis.
| Field Name | Constraints | Purpose |
| Id | Not null | Id |
| Food type | Null | Type of food-Veg/Nonveg |
| Type of oil | Null | Type of oil |
| Fruit-days | Null | No. of days eaten |
| Fruit-servings | Null | No. of fruit consumption |
| Vegetables | Null | No. of days eaten |
| Vegetable-serving | Null | No. of Veg consumption |
| Salt-used | Null | Extra salt consumption |
Table-3.3 Dietary Habits
4._PhysicalActivity
Physical activity table enables to store the details of the physical activity done by the user which can be used for analysis.
| Field Name | Constraints | Purpose |
| Id | Not null | Id |
| Work | Null | Work |
| VI-work | Null | Vigorous Intensity |
| VIW-Days | Null | Vigorous Intensity work |
| VIW-Time | Null | Vigorous Intensity work |
| MI-work | Null | Moderate Intensity |
| MIW-Days | Null | Moderate Intensity work |
| MIW-Time | Null | Moderate Intensity work |
Table 3.4 –Physical Activity 5. tbl_health
Health table enables to store the physical detail of the user which can be used for analysis.
| Field Name | Constraints | Purpose |
| Id | Not null | Id |
| Height | Null | Height |
| Weight | Null | Weight |
| Obesity | Null | Obesity |
| BMI | Null | Body Mass Index |
| Diet | Null | Diet |
| SystolicBP | Null | Blood Pressure |
| DiastolicBP | Null | Blood Pressure |
| Cholesterol | Null | Cholesterol |
Table-3.5 Health
6. tbl_login
Login table stores username and password.
| Field Name | Constraints | Purpose |
| Username | Not null | Username |
| Password | Not null | Password |
Table-3.6 Login
HIGH LEVEL DESIGN
High-level design explains the architecture that will be used for the development of software. This architecture provides the overview of the entire system and explains it in non-technical to technical terms which can be easily understandable by the administrator.
3.3.5 TECHNICAL ARCHITECTURE
The system architecture mainly consists of five phases each phase has its own importance.
The phases of architecture are data gathering, data processing and visualization.
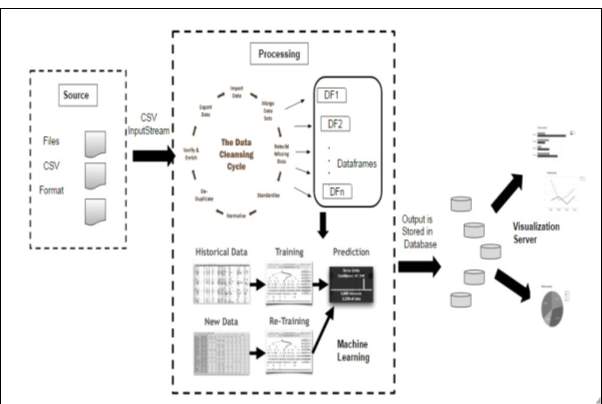
Fig 3.8 Detailed Architecture of System
Detailed Architecture of the system gives the insight view of each and every phase. This will represent the working of the model. The model contains data collection which collects the appropriate data with the help of a questionnaire. That data will be divided into data frames. Data frames divide the data into the small set of tuples. CSV input stream will be provided to the processing engine where data cleaning is done. Cleaning of data contains handling of the missing value and normalizing the data. The data frames are supplied to the machine learning algorithm. The training data set is used for the prediction then new or test data set is supplied to the same model for prediction.
Data Cleaning is carried out using SQL queries in apache spark. Various constraints are seen while cleaning the data in order to get data according to the need of the model. The data frames are made from the data set using apache spark libraries. The machine learning algorithm is used from ML Library which is a part of apache spark. The decision tree algorithm from the spark helps to classify and predict the data. For validation both over fitting and under fitting need to be done. K- Fold cross validation will be used to minimize the noise while testing the fitness of the data
The predicted data as an output is stored in the database which will be queried to retrieve meaningful information from that and is used to represent that analytical information in form of charts and graphs. The charts are displayed using Dev extreme library and the data from the rest API is called using procedures from the database. The data can be saved as CSV and text file. This output will be used to displaying various dashboards. The data will be stored in the database and queried to get the meaningful information which can be presented in the form of dashboards.
3.3.6 APPLICATION ARCHITECTURE
The application architecture contains the front end of the program of the web application. Functionality will vary based on the login privileges of the user then need to login. The administrator will have access to the administrative rights and permissions given to them. At present, the system contains the default username and password as admin as no. of users are not added to the system.
All the dashboards will be built using JavaScript in the Web Browser. The server only ever provides one HTML document, together with JavaScript code that handles interaction with the server and user interface. There are no links to other pages or form requests that would cause the page to be reloaded.
The server-side application only provides a data access layer, which is accessible via a RESTful web service interface and the data is transferred in JSON format.
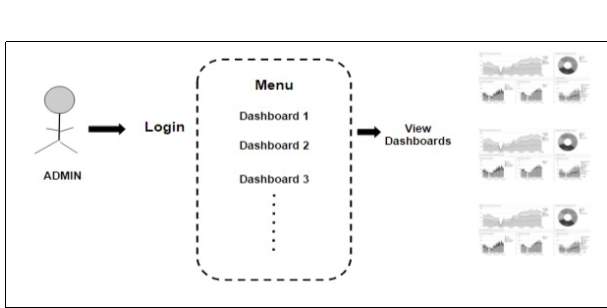
Fig 3.9 Application Architecture
The user interface is very simple and plain layout easy to use by the user as well as admin. It will display information very clearly for the user and output to the user through pages.
3.4 MODULE DESCRIPTION
Module Description provides detailed information about the module and it supported components. There are different phases in the system.
1. DATA COLLECTION
The data gathering is done using questionnaire which contains questions related to the lifestyle habit of the individual. It contains dietary habits, alcohol consumption, tobacco use and physical activity. The Figure shows the questionnaire which is used for the collection of the data.
The raw data has been gathered from the rural area and given as csv file as input format. The input format is the CSV data source for spark. This package allows reading CSV files in local or distributed file system as Spark Data Frames.
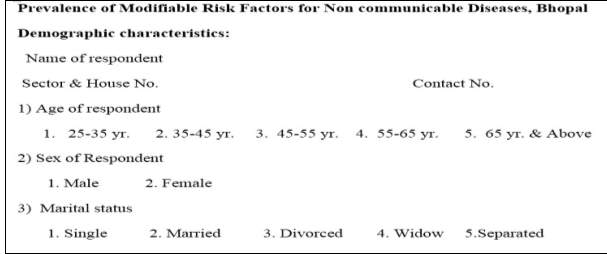
Fig 3.3 Questionnaire for NCD
Spark Data Frames are the collection of distributed data that is organized in the form of rows and columns just like a relation or a table in database. The only difference is it optimizes it in a richer manner. Data frames can be created using structured data set file or from existing resilient distributed datasets (RDD). Data frames supports SQL so the execution can be performed easily to obtain the result. While dealing with the datasets present we can filter and handle tuples and can make desired changes.
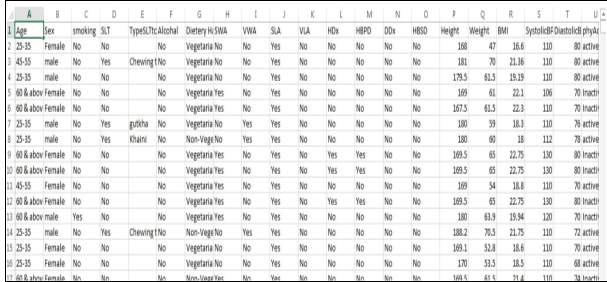
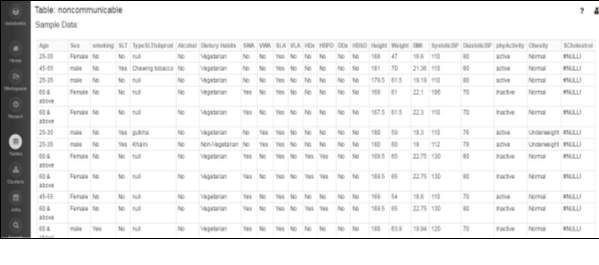
Fig 3.4 Dataset for NCD
The dataset contains various fields like alcohol consumption, tobacco use, age, sex, marital status, type of tobacco product consumption and other parameters. The study was carried out in an urban slum for determining the prevalence of modifiable risk factors for NCDs. A total of 1270 adults were studied. The datasets which are mainly used are alcohol, tobacco, physical activity, height and weight, BMI and hypertension and many more. Some of the fields and its parameters are listed below which helped in prediction of the disease.
Tobacco Use
For this study, smoking includes manufactured bidis & cigarettes, hand rolled bidis, chillam, hukka and pipe smoking with tobacco as main ingredient. Smokeless tobacco included gutkha, khaini, plain tobacco, pan masala & mishri containing tobacco.
Alcohol Consumption
For this study, alcohol included desi daaru (local, country made liquor), beer, rum, whisky etc.
Use of alcohol was defined and classified as follows:
- Standard Drink: It was defined as any standard drink with net alcohol content of 10 gram ethanol. This was converted to 30 ml of standard spirit, one standard bottle of regular beer (285 ml) or 1 medium size glass of wine (120 ml) for practical usage.
- Current Drinker: Those who consumed one or more than one standard alcoholic drink in the year preceding the survey.
- Former Drinker: Those who have consumed alcohol but those who did not consume one or more drink during the year preceding the survey.
- Lifetime Abstainer: Those who have never consumed one or more drink of any type of alcohol in lifetime.
Body Mass Index (BMI)
Body mass index can be calculated by the formula:
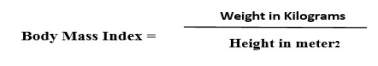
BMI values are age independent and the same for both sexes. Various categories are as follows:
| SCORE | CLASS |
| ≤ 18.4 | Under weight |
| 18.5-24.9 | Normal weight |
| 25-29.9 | Grade 1 overweight |
| 30-39.9 | Grade 2 overweight |
| ≥40 | Grade 3 overweight |
Table-3.7 BMI Value
For the result to identify the obesity, a cut-off of 25 was taken. If BMI was more than or equal to 25, the individual was considered overweight.
Blood Pressure
According to the blood pressure various parameters for the hypertension is classified:
| SYSTOLIC BP DIASTOLIC BP | CLASSIFICATION |
| ≤119 and ≤79 | Normal |
| 120-139 or 80-89 | Pre hypertension |
| 140-159 or 90-99 | Stage 1 hypertension |
| ≥160 or ≥ 100 | Stage 2 hypertension |
Table-3.8 Blood Pressure
Hypertension was considered to be present if the individual fell into the category of Stage 1 or Stage 2 hypertension. Normal and pre hypertensive individuals were labelled as no hypertension.
Height & Weight
The height and weight are the dependency variables as on the basis of these different parameters like BMI and Obesity affects.
2. DATA PROCESSING
The data processing consists of various steps data preparation which involves dealing with the missing value, normalization of the data and customizing the data according to the need. It is also consist of machine learning algorithm which came from ML Library to predict the data. a)Data Preparation
The inconsistency in data is caused by the human error while entry. Data cleaning or data scrubbing is done for detecting and removing the corrupt information. This includes cleaning the data, formatting, taking care of missing values and filtering relevant data, mean normalization of data is done. This cleaning process help to reduce number of errors while processing of the pipeline. This will divide the data in data frames which can be processed further.
Data frames are the collection of data distributed over columns. It is somewhat equal to the tables or the relations in the database. The data frames can be constructed from the large amount of dataset that may be structured data files or may be from existing RDD. Data frame is a word that is domain specific it is the distributed data set. We can include SQL while working with data frames that will help to handle the missing information in the database.
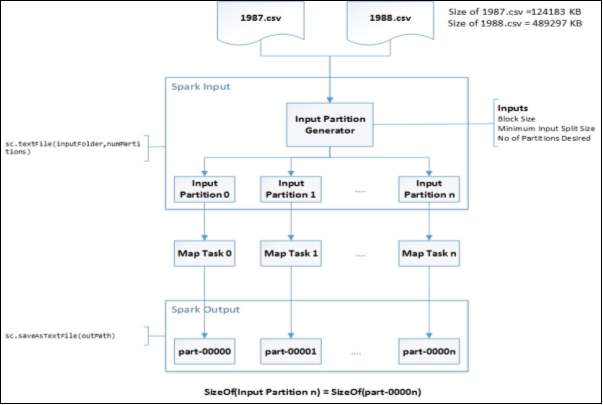
Fig 3.10 Data Frames
b) Machine Learning Algorithm
MLib is a library used in spark which contains different machine learning algorithm for predictive analysis. Decision tree is used for predicting the required data and classifying data. This helps in making decisions in uncertaininty and present a visual representation of the decision situation.It also takes us from different scenario, when different data item selection is done then it will give a decision tree based on the selected data item.
In this work decision tree helps in classifying the data based on the age, smoking habits, alcohol consumption. This also helps in regression as it predicts the number of people addicted to smoking. In similar manner number of people within a age group having different habits like taking smoking products, work activity which will help to predict a disease.
This algorithm also save data preparation time, as they are not sensitive to missing values and outliers. Missing values will not stop you from splitting the data for building a decision tree. Data splitting on the decision tree is done based on the samples not on the exact absoulte value. Thus, detaching will not affect the decision tree.
The decision tree is use for classification and regression . It is mostlty used to handle the categorical data as well as continuous data . It partitions the data row wise for implementation. It contains inputcol and outputcol where inputcol contains a labelCol and outputCol will contain the feature col.
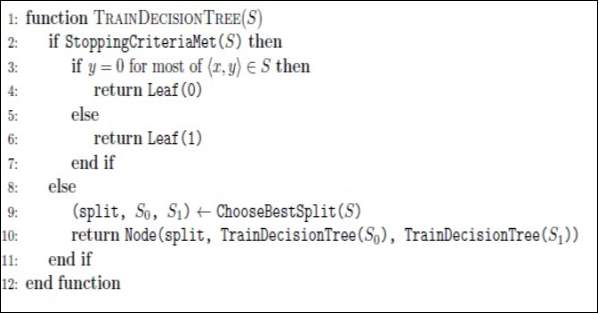
Fig 3.11 Pseudo code for training decision tree
This algorithm uses features and number of bins to split it in the best way each node pair. The decision tree stops to grow when the given max depth is equal to the current depth of the tree.
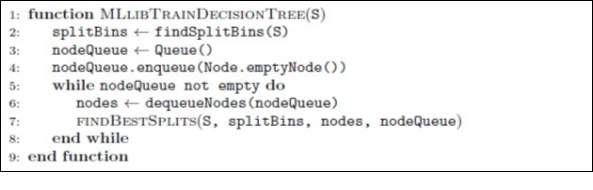
Fig 3.12 Pseudo code for training decision tree using ML Lib
This algorithm uses MLlib. This is used to train the decision tree. The data is placed in the number of bins before training of sample input data. While training the data whichever node is required to split is kept in a queue. After every cycle, each node will be pulled out of the queue as per the memory space. Depending on its functioning the statistics are made and is gathered for all partitioned sets. The split value will be sent to the root node which helps the root node to split and create more nodes and adding again the nodes into the queue as the requirement.
c) Validation
For validation we need to check both overfitting and underfitting.
- Overfitting: As Predictor is too flexible it fits noise in the training data . This can find another predictor which makes more mistake on training data Etrain(F’)>Etrain(F) but few mistakes are unseen on future data Egen (F’)<Egen(F).
- Underfitting: Predictor is too simple. This is not enough powerful to capture the salient patterns in data.
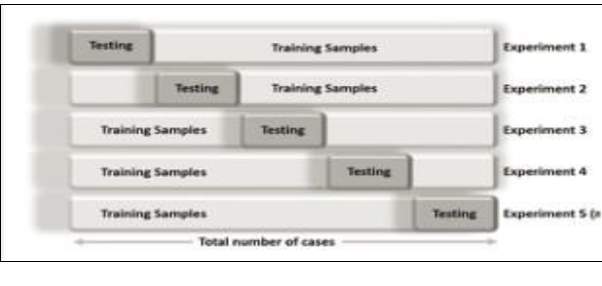
K- Fold Cross Validation will be used to minimize the noise while testing the fitness of the data. In k-fold cross validation the data is partitioned into k equally sized segments or folds. K repetitions of training and proofing is performed in a way that within each repetition a different fold of the data will be taken out for proofing while the remaining k-1 folds used for learning. Before this process Stratification is done which is the process of representing the

the data in a good representative form. The final error estimation of the classification is obtained by averaging the individual error estimates:
3. OUTPUT FORMAT
The data can be saved as csv and text file. This output will be used to displaying various dashboards. The data will be stored in the database and queried to get the meaningful information which can be presented in the form of dashboards.
4. VISUALZATION FRAMEWORK
It uses Single Page Architecture (SPA), all the dashboards and reports will be built using JavaScript in the Web Browser. The server only ever provides one HTML document, together with Java script code that handles interaction with the server and user interface. There are no links to other pages, or form requests that would cause the page to be reloaded. Instead, the JavaScript application modifies the contents of the initially loaded page.
The server-side application only provides a data access layer, which is accessible via a RESTful web service interface and the data is transferred in JSON format. The JavaScript application that runs in the browser is then a web service client. Visualization server will be a REST based service that provides the various funcationality via web browsers.
The data has been given to the visualization framework which will represent data in the form of charts. The dashboards represent the information and provide analytics which will represent the required information
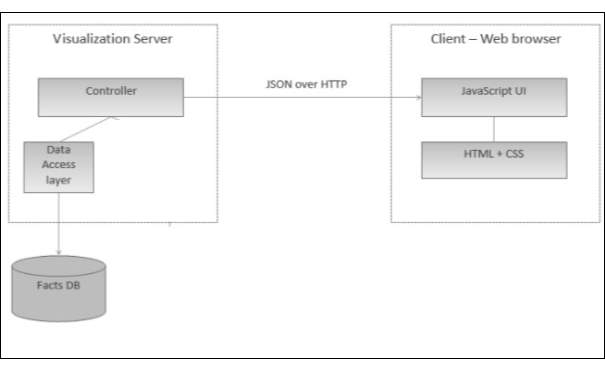
Fig 3.14 Single Page Architecture for Visualization Server
3.5 SOFTWARE & HARDWARE REQUIREMENTS
3.5.1 HARDWARE REQUIREMENTS
Development Environment
Operating System
Windows 7/8/10
Pentium III/IV (preferably P-IV & more) 1.6 GHz CPU.
Tools
IntelliJ IDEA 2017
RAM 1 GB minimum, 2 GB Recommended
300 MB hard disk space + 1G for cache
MySQL Workbench
RAM 4GB minimum, 6GB Recommended
MariaDB 10.1.20
RAM 1GB
Hard Disk 1GB
Databricks
Deployment Environment
- Maria DB
- Activator installation
- Web Browser – Chrome / IE / Firefox/ Safari
3.5.2 SOFTWARE REQUIREMNTS
IntelliJ IDEA
JDK 1.6 and Higher
MySQL Workbench
Microsoft .NET Framework 4.5
Microsoft Visual C++ 2015 Redistributable Package
Gradle
Java JDK or JRE version 7
Activator play framework
Java 1.8
Language
Python
RAM 1GB
Java SE Runtime 32-bit
- Scala 2.12
Requires Java platform version 8
- Angular JS
- Dev Extreme Library
IMPLEMENTATION OF SYSTEM
Implementation of the system covers tool and technology used. What are the advantage of using the tools and these technology? The language used and the system implementation.
4.1 TOOLS & TECHNOLOGY
This covers various tools and technology used for the implementation of the project. The technology used are open source technologies which will be used for the development of the application.
4.1.1 DATABRICKS APACHE SPARK
Apache Spark is open source platform which provides processing engine which is easy to use, and can provide sophisticated analytics. Data brick provides a virtual analytical platform over apache spark that helps to easily build and provide solution for the analytical problems. It also consists of a cluster which can be easily created and can be linked to the project. This also provide the cluster space of 6 GB which is freely available for the community edition of the data bricks. Data bricks provides a way to make Spark easy to use and run. There various benefits of using apache spark:
Speed: Processing of the large scale data can be 100 times faster than any Hadoop system.
It is also too fast even when data is stored on disk.
Ease of Use: It deals with large dataset and provide ease to use.
Unified Engine: Spark comes with high level libraries, also supports SQL queries, data streaming, and machine learning library and for graph processing. These standard libraries will increase the productivity.
This helps in optimization of steps in data processing. It will hold intermediate result in memory rather than in a disk which is helpful when we need to use the same data set again and again. Spark runs on Java Virtual Machine (JVM).
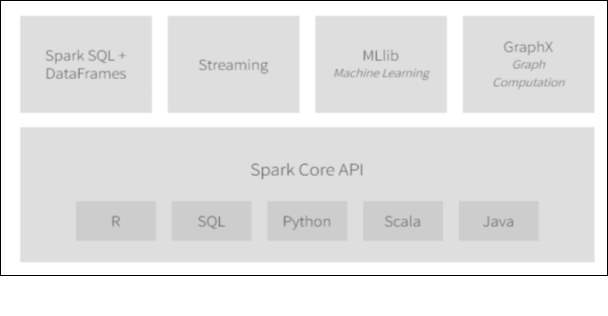
Spark Streaming:
It is used to stream real-time data. Performs processing and computing. It has Dstream which is collection of RDD which is used to process the data.
Spark SQL
The Spark SQL gives the capability to the spark dataset to be exposed over JDBC which allows to run the SQL queries. The Spark SQL provides the capability to ETL the data in various format.
Spark MLib
This consists of various machine learning algorithm which are commonly used for classification, regression filtering, collaborating, predicting and optimizing the information.
Spark GraphX
This introduces a spark API which provides graphs to support visualization property and provides the facility to plot various graphs and charts.
4.1.2 PLAY FRAMEWORK
Play framework is used for integrating all the applications of java and Scala. This project uses Scala in the rest API. For integrating all the components in the application framework play framework is used. This requires minimum consumption of resources for applications.
The different APIs are used for Java and Scala. Scala follows MVC API.
Play can be configured by integrating application.conf file to the application or a play property play.crypto.secret is used. The server requires a build.sbt settings that need to be defined for the project. Play defines the default settings which are suitable for the framework. These will work with the required playScala plugin.
4.1.3 MARIADB
This is the Open source software freely available and supports MySQL. Maria DB is used because it is scalable, supports various storage engines, fast and robust. It includes various plugins and tool for migration of data between servers like migration wizard, schema wizard. It also supports the data and schema import and export functionality.
4.1.4 DEV EXTREME LIBRARY
Dev Extreme has everything that is needed to contain HTML and JavaScript. This supports various library and helps to create single page application. It supports various charts like bar, line, stacked bar chart and others. This tool is based on CSS3, HTML5 and JavaScript.
It also supports angularJS and knockout.

Fig 4.2 Dev Extreme Overview
For displaying the chart various chart options are present for each type of chart whose property will be set as per the need. The data is provided as datasource to the chartoptions which is to be displayed as chart.
4.1.5 ANGULARJS
AngularJS supports single page application. It provides routing capabilities, compatible to different browsers. It helps to create custom html elements according to the need. It supports MVC architecture as it consist of models, view and controller. If we need to support dynamic application then it supports well with it. It is having the capability to create a framework which is most suited for the application.
The modular development of the angularjs helps to reuse the code as it is a modular programming. Services provides an API to the application but it is not the part of MVC.
4.1.6 SCALA
Scala is provides support for the functional language. The term scala refers to the scalable language. This language is used in mission critical applications. This Object oriented meets all the functional requirement. This runs on JVM so that it is platform independent.
4.2 ENVIRONMENTAL SETUP
Client Development Environment
Install following software:
- IntelliJ IDEA
- JDK8
- Gradle
- Activator
- My SQL Workbench
- Maria DB
Configuration
Activator: Configure path for the activator in environmental variables. Set path to the activator bin directory.
JDK: Configure path for JDK in environmental variables. Create a new variable and put the path of JDK.
Build the Client Side Project using npm install.
To create a package for the visalizationserver – activatordist is used
Client Deployment EnvironmentFollowing Software are required:
- MariaDB Installation
- Install MariaDB.
- After installation is successful, Open HeldiSQL or any mariadb client. iii. Create new session and provide the root password given during installation of MariaDB. iv. Execute the schema and the import the csv file to get the data in the database.
Activator installation
- Activator package in the form of visualizationserver-1.0 zip will be created.
- Copy the extracted folder to the C: drive iii.Open the application.conf file from visualizationserver/conf/application.conf and change the play.crypto.secret = ”changeMe”. Give any password different than the default one. iv. If any RUNNING_PID file present in bin folder, delete it.
v. Open Command Prompt and go ti the bin folder of the activator
(“C:visualizationserverin ”). Run following command: visualizationserver.
Configure MariaDB with Activator
- Navigate to location C:ProjectFolderConf
- Open “application” file and update slick.dbs.default.db.url =
“jdbc:mysql://localhost:3306/database_name if activator and mariadb is on the same machine.
4.3 IMPLEMENTATION
This consist of the following phase’s data collection, data cleaning, data preparation, machine learning algorithm, validation and visualization.
Databricks is used for the implementation of following modules data cleaning and data processing. First data is exported in data bricks and then processing is carried over it with the help of spark libraries.
Following steps are carried out:
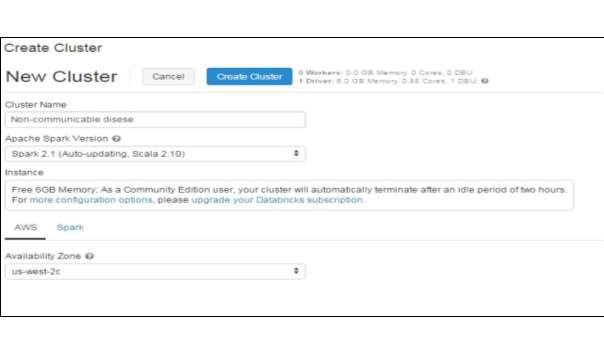
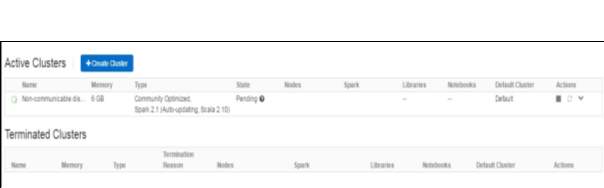
Fig 4.4 Cluster Running
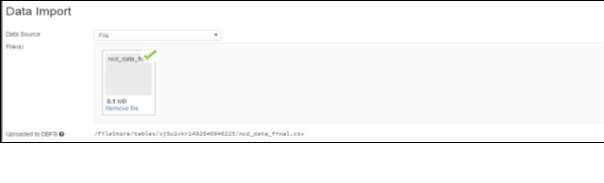
Step 3: Import the dataset which is stored in data bricks file system.
Step 4: Viewing the data
Step 5: Notebook is created to read the data from the tables by using
sqlContext.read.format and .load class. Next the data in cache will be displayed. It is converted in a suitable format as required.
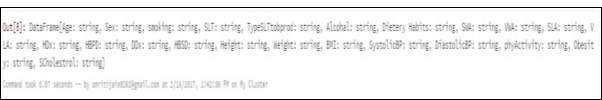
Fig 4.7 Cache Data
Step 6: Display the dataset. Count number of rows in the data set and split that dataset randomly in 70 % as training dataset and 30 % as test dataset. This displays the count of training as well as test data set.
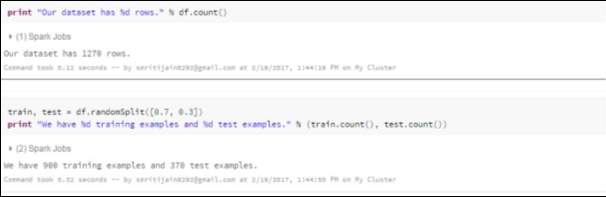
Fig 4.8 Training & Test Data
Step 7: It is passed to the ML Library Decision tree. Build tree classifier. Define the depth of the tree. Apply the learning model and find the probability for each model.The less depth model is used as they are not so expressive but less prone to over fit whereas maxDepth models are more expressive but are likely to be overfit and are more costly for training.
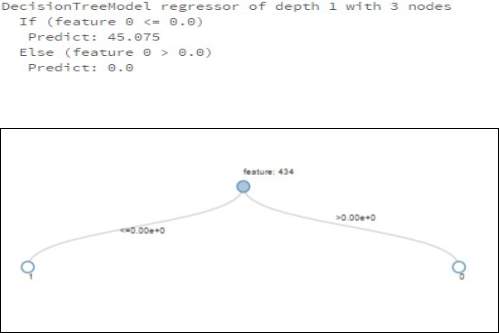
Fig 4.9 Decision Tree
Step 8: To check the validation k-fold cross validation is applied over it.
Step 9: The data is stored in the database that is in MariaDB
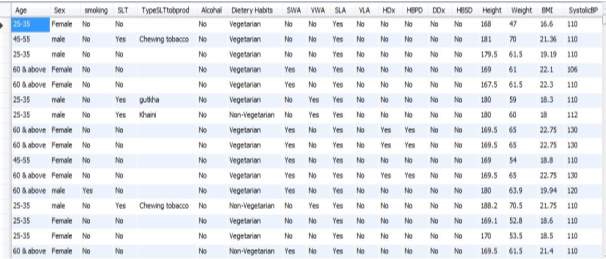
Fig 4.10 NCD Data
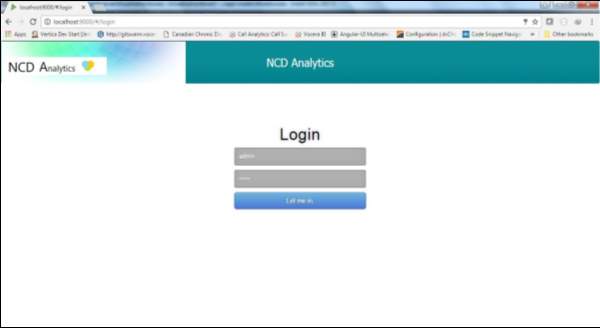
Fig 4.9 Login Screen
This is the login screen for the NCD Analytics. By Default user name and password is admin , admin.
Fig 4.10 Home Screen
This represent the home screen which contains various dashboard as menu as you click on the dashboard menu desired dashboard can be seen.
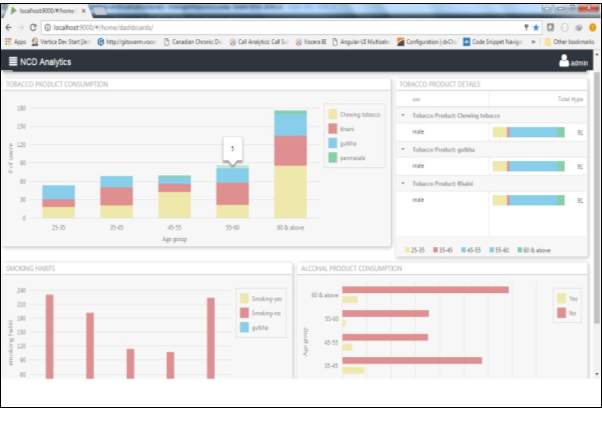
Fig 4.11 Dashboard for Tobacco Details
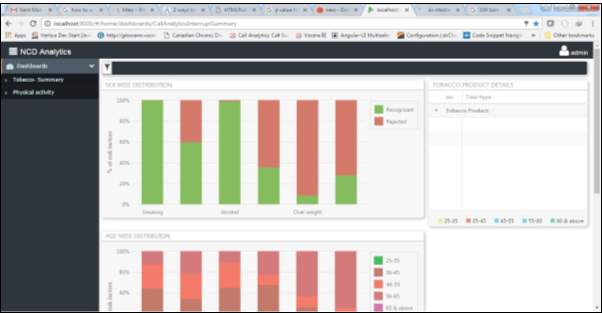
Fig 4.12 Dashboard for the physical activity
RESULTS & DISCUSSIONS
3.4 PERFORMANCE EVALUATION
Various techniques are used for the prediction of disease. The comparative study is shown in the table below with accuracy as the factor. This presents the accuracy given by the machine learning library.
| Author | Techniques Used | Accuracy | |
| Ms. shtake S.H , &Prof.Sanap S.A.
[14] |
Decision Tree | 94.93% | |
| Naive Bayes | 95% | ||
| Neural Networks | 93.54% | ||
| Chaitrali
S. Dangare [15] |
Decision Tree | 90% | |
| Naive Bayes | 99.62% | ||
| Neural Networks | 100% | ||
| Jyoti
Soni[16] |
DM
With ANN |
Decision Tree | 89% |
| Naive Bayes | 86.53% | ||
| Neural Networks | 85.53% | ||
| DM
With GN |
Decision Tree | 99.2% | |
| Naive Bayes | 96.5% | ||
| Classification via Clustering | 88.3% | ||
| AH Chen, SY
Huang, PS Hong, CH Cheng, EJ lin [17] |
Neural Networks | 80% | |
| Vikas Chaurasia,
[18] |
CART | 83.49% | |
| ID3 | 72.93% | ||
| Decision Table | 82.50% | ||
Table 5.1 Comparative study of various machine learning algorithm
Various techniques are used and a comparative study is carried out to among different algorithms which presents that decision tree algorithm gives more accuracy in prediction of the disease as it is helps to provide a label to most of the features extracted. In the study decision tree algorithm is used for the prediction of the disease and it will use the significant factor that helps to make check different condition on it.
3.5 PARAMETERS UNDER STUDY
The parameters considered in the project is obtained from the rural area of the Bhopal. The results relevant to the objective of the study is listed.
1.Distribution of the population as per the gender
A total 1270 individuals participated in the study out of which 624 (49.1%) were male and 646 (50.9%) were female.
|
Gender |
Number (N) |
Percentage (%) |
|
Male |
624 | 49.1 |
|
Female |
646 | 50.9 |
|
Total |
1270 | 100 |
Table 5.1 Distribution over gender
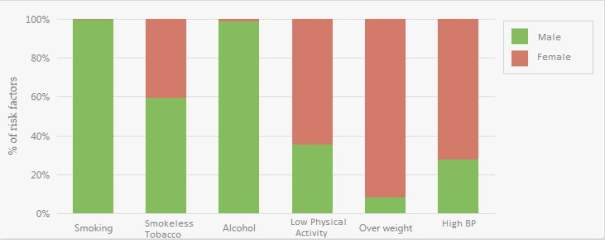
2.Sex wise distribution of the modifiable risk factors
The sex wise percentages of respondents according to modifiable risk factors. Total 31.9% study participants were smokers, out of which 64.4% were males & only 0.3% were females. 59.1% of the respondents were smokeless tobacco consumer. Among males, 446 (71.5%) were smokeless tobacco consumers whereas female tobacco consumers were only 305 (47.2%). As regard alcohol consumption substantial number of males (45.5%) consumed some or other form of alcohol as compared to only 0.5% women who consumed the same. Males were more active and low physical activity was observed in only 33.2% males as compared to 58.7% in females. 2.2% men and 25.1% women were overweight. Among the respondents, the prevalence of high blood pressure was 20.1%, which is more (28.5%) amongst females as compared to 11.4% in males.
|
Risk Factor |
Sex |
Total (n=1270) |
|||
| Male (n=624 ) | Female (n=646) | ||||
| N (%) | N (%) | N (%) | |||
|
Smoking |
Yes
|
403 (64.6) | 02 (0.3) | 405 (31.9) | |
| No | 221 (35.4) | 644 (99.7) | 865 (68.1) | ||
|
Smokeless tobacco |
Yes
|
446 (71.5) | 305 (47.2) | 751 (59.1) | |
| No | 178 (28.5) | 341 (52.8) | 519 (40.9) | ||
|
Alcohol |
Yes
|
248 (45.5) | 03 (0.5) | 287 (22.6) | |
| No | 340 (54.5) | 643 (99.5) | 983 (77.4) | ||
|
Low physical activity |
Yes
|
207 (33.2) | 379 (58.7) | 586 (46.1) | |
| No | 417 (66.8) | 267 (41.3) | 684(53.9) | ||
|
Overweight |
Yes
|
14 (2.2) | 162 (25.1) | 176 (13.9) | |
| No | 610 (97.8) | 484 (74.9) | 1094 (86.1) | ||
|
High BP |
Yes
|
71 (11.4) | 184 (28.5) | 255 (20.1) | |
| No | 553 (88.6) | 462 (71.5) | 1015 (79.9) | ||
Table 5.2 Sex wise Distribution
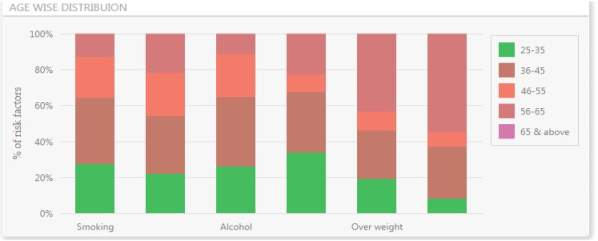
3.Age wise distribution of modifiable risk factors
The prevalence of smoking among study participants was increasing with age from 30.3% in 25-35year to 41.8% in 36-45 & 46-55 year and then declining among older age groups whereas prevalence of smokeless tobacco users was consenting increasing with age (36.1% in 25-35 year & 78.2% in more than 65 year age group). People from most economic productive age group i.e. 25-55 year were found to have high prevalence of alcohol consumption. Large proportion of respondents were recorded in the category of low physical activity (46.1%) and it is varying with age groups (37% in 25-35, 37.2% in 36-45, 17.9% in 46-55, 53.5% in 56-65, 85.8% in more than 65 years). The prevalence of overweight was found increasing with age except in 46-55 year age group. Prevalence of HTN was recorded highest in age group more than 65 years.
|
Risk Factor |
Age (In years) |
Total (n=1270) |
|||||
| 25-35
(n=330 ) |
36-45
(n=328) |
46-55
(n=196 ) |
56-65
(n=155) |
>65
(n=261 ) |
|||
| N (%) | N (%) | N (%) | N (%) | N (%) | N (%) | ||
|
Smoking |
Yes
|
100 (30.3) | 137 (41.8) | 82
(41.8) |
48
(31) |
38
(14.6) |
405 (31.9) |
| No | 230 (69.7) | 191 (58.2) | 114 (58.2) | 107 (69) | 223 (85.4) | 865 (68.1) | |
|
Smokeless tobacco |
Yes
|
119 (36.1) | 176 (53.7) | 132 (67.3) | 120 (77.4) | 204 (78.2) | 751 (59.1) |
| No | 211 (63.9) | 152 (46.3) | 64
(32.7) |
35
(22.6) |
57
(21.8) |
519 (40.9) | |
|
Alcohol |
Yes
|
66
(20) |
98
(29.9) |
60
(30.6) |
29
(18.7) |
34
(13) |
287 (22.6) |
| No | 264
(80) |
230 (70.1) | 136 (69.4) | 126 (81.3) | 227 (87) | 983 (77.4) | |
|
Low physical activity |
Yes
|
122
(37) |
122 (37.2) | 35
(17.9) |
83
(53.5) |
224 (85.8) | 586 (46.1) |
| No | 208
(63) |
206 (62.8) | 161 (82.1) | 72
(46.5) |
37
(14.2) |
684(53.9) | |
|
Overweight |
Yes
|
16
(4.84) |
22 (6.7) | 09 (4.6) | 36
(23.2) |
93
(35.6) |
176 (13.9) |
| No | 314 (95.2) | 306 (93.3) | 187 (95.4) | 119 (76.8) | 168 (64.4) | 1094(86.1) | |
|
High BP |
Yes
|
8
(2.4) |
29 (8.8) | 8
(4.1) |
55
(35.4) |
155 (59.4) | 255 (20.1) |
| No | 322 (97.6) | 299 (91.2) | 188 (95.9) | 100 (64.5) | 106 (40.6) | 1015(79.9) | |
Table 5.3 Age wise Distribution
4.Gender wise distribution of Height, weight & BMI
Mean height of the study participants was 170.48 cm and mean weight was 63.24 kg. Males had generally higher height and weight as compared to females. The mean BMI was 21.9 kg /m2. Female had higher BMI as compared to males.
|
Parameter |
Gender |
Total (n=1270) |
|
| Male | Female | ||
|
Mean(SD)
|
Mean(SD) |
Mean (SD) |
|
|
Height (cm)
|
177 (6.20) | 163.89 (6.39) |
170.48 (9.2) |
|
Weight (kg)
|
64.9 (5.4) | 61.5 (10.7) |
63.24 (8.69) |
|
BMI (kg/m2)
|
20.79 (1.99) | 23.01 (24.29) |
21.9 (3.54) |
Table 5.4 – Height, Weight and BMI distribution
5. Distribution on Physical activity
The mean time spent in work related vigorous physical activity was 497 minutes per day and it was 499 minutes/ day for male & 484 minutes/ day for female whereas, mean time spent in work related moderate physical activity was 372 minutes per day and it was 398 minutes/ day for male & 357 minutes/ day for female. The mean time spent in travel related activity (cycling/waking) was found to be 61 minutes/day. The time spent in travel related activity was more among males (67 minutes/day) then females (52.7 minutes/day). Our study also reports that the mean time spent in vigorous & moderate leisure/recreational activity was 45 and 30 minutes per day respectively. It can be seen from table-15 that, men spent more time than women in all type of physical activity (Work related, transport related leisure/recreational activity.
|
Physical activity (in minutes)
|
Gender |
Total (n=1270) |
||
|
Male |
Female |
|||
|
Mean(SD)
|
Mean(SD) |
Mean (SD) |
||
|
Work related
|
Vigorous |
499.1 (100.5) | 484.4 (104.5) | 497.7 (100.81) |
|
Moderate |
398.6 (136.4) | 357.0 (99.4) | 372.9 (116.6) | |
|
Transport related
|
67.16 (45.9) | 52.7 (30.26) | 61.65 (41.29) | |
|
Leisure time related |
Vigorous |
45 (20.6) | 0 | 45 (20.5) |
|
Moderate |
39.29 (24.86) | 26.6 (11.1) | 30.43 (17.31) | |
Table 5.5-Distribution of Physical Activity
The following parameters derives the common risk factors for the non-communicable disease. The Chi-Square is computed by following steps:
- For each observed result subtract the expected result (O-E)
- The difference is computed and it is squared (O-E)2
To interpret the result the P value <0.0001 is used.
|
Risk Factor |
Alcohol consumption
|
χ2 df=1
|
P value
|
||
|
Present (n=287) |
Absent (n=983) |
||||
| N (%) | N (%) | ||||
| Low physical activity | Yes
|
100 (34.8) | 486 (49.4) | 19.04 |
<0.0001
|
| No
|
187 (65.2) | 497 (50.6) | |||
| Overweight | Yes
|
9 (3.1) | 167 (17) | 622.6 |
<0.0001 |
| No
|
278 (96.9) | 816 (83) | |||
| High BP | Yes
|
34 (11.8) | 221 (22.5) | 409.5 |
<0.0001 |
| No
|
253 (88.2) | 762 (77.5) | |||
Table -5.6 Association between Alcohol consumption and various risk factors This shows there is a significant association between alcohol consumption and low physical activity, being overweight and high blood pressure.
The Risk factors include behavior like tobacco usage, alcohol usage, lack of physical activity, unhealthy diet, obesity, stress and environmental factors lead to the major disease burden of NCDs. These elements are modifiable and controllable, so that incidence of NCDs can be reduced. This data is helpful in predicting the disease on the basis of these parameters. These lifestyle habits help to predict the disease.
| Risk Factors | Diabetes | Cancer | Hyper-
Tension |
Cardio- vascular
Disease |
| Smoking / tobacco | Y | Y | Y | Y |
| Raised Blood Pressure | Y | Y | Y | Y |
| Alcohol Consumption | Y | Y | Y | |
| Physical Activity | Y | Y | Y | Y |
| Blood Sugar Level | Y | Y | Y | |
| Obesity | Y | Y | Y | Y |
Table-5.7 Risk of having the disease
The Y represents the risk of having a disease.
CONCLUSION & FUTURE WORK
The research work aims to estimate the common risk factors for NCDs among the population. This will help the common people who are not aware about the risk factors for NCD which undergone various parameters like obesity, vigorous work, smoking and high blood pressure and many more. Existing project focus on the urban area and algorithm used is able to predict only for diabetes other diseases are not covered. In this data from the rural area has taken where people are less educated about such diseases. This unstructured data will be pre-processed to produce structured dataset. This will predict the disease on basis of some lifestyle habits.
The structured data after pre-processing from apache spark is used to store it in database on which analytics will be performed. The prediction of the disease on the basis of lifestyle habits is done by machine learning algorithm that is decision tree. The analytical result will be represented on the dashboards. Following conditions are kept on lifestyle habits to predict the particular disease. This helps the common people to get better knowledge to improve their lifestyle habits.
In Future this work can be implemented in the hospitals which help the doctors and nurses in better decision making. For the people in rural area this is helpful on the basis of study finding they can be recommended to the physician. An alert signal will be generated when it is prone to disease. When the lifestyle parameters exceeds the value of each factor then the alert signal will help the people and guide them to give proper lifestyle habits.
APPENDICES
APPENDEX A: SAMPLE CODE
Data Processing – Sample code import org.apache.spark.mllib.tree.DecisionTree import org.apache.spark.mllib.util.MLUtils
// Load and parse the data file.
// Cache the data since we will use it again to compute training error.
val data = MLUtils.loadLibSVMFile(sc,
“/FileStore/tables/hk5iibtm1491229419571/new.txt”).cache()
// Train a DecisionTree model.
// Empty categoricalFeaturesInfo indicates all features are continuous. val categoricalFeaturesInfo = Map[Int, Int]() val impurity = “variance” val maxDepth = 5 val maxBins = 100
val model = DecisionTree.trainRegressor(data, categoricalFeaturesInfo, impurity, maxDepth, maxBins)
// Evaluate model on training instances and compute training error val labelsAndPredictions = data.map { point =>
val prediction = model.predict(point.features)
(point.label, prediction)
} val trainMSE = labelsAndPredictions.map{ case(v, p) => math.pow((v – p), 2)}.mean() println(“Training Mean Squared Error = ” + trainMSE) println(“Learned regression tree model: ” + model)
Visualization Server – Sample code
Template
<va-dashboard db-id=”1″ db-name=”Alarm Analytics”>
<va-widgets-container show-if=”interruptType=calls”>
<va-widget widget-title=”Tobacco Product Consumption” width-class=”col-sm-12 col-md-8 col-lg-8″ height=”300″ filter-subscriber-
for=”fromTime|toTime|callerSite|callerDeviceType|receiverDeviceType|targetType” chart-options-builder=”BaseChartOptionsBuilder” chart-options-
source=”assets/chart_options/tobaccoProductConsumptionSummary.json” analytics-data-
source=”assets/test_resource/tobaccoProductConsumptionSummary.json” type=”chart”/>
<va-widget widget-title=”Tobacco Product Details” width-class=”col-sm-12 col-md-4 col-lg-4″ height=”320″ filter-subscriber-
for=”fromTime|toTime|callerSite|callerDeviceType|receiverDeviceType|targetType” chart-options-
source=”assets/chart_options/callSummary_targetDeviceType_chartOptions.json” analytics-data-source=”/assets/test_resource/tobaccoHabits_summary.json” type=”templated-grid”/>
<va-widget widget-title=”Smoking Habits” width-class=”col-sm-12 col-lg-6″ height=”300″ filter-subscriber-
for=”fromTime|toTime|callerSite|callerDeviceType|receiverDeviceType|targetType” chart-options-builder=”BaseChartOptionsBuilder” chart-options-source=”assets/chart_options/smokingSummary.json” analytics-data-source=”assets/test_resource/smokinghabit.json” type=”chart”/>
<va-widget widget-title=”Alcohal Product Consumption” width-class=”col-sm-12 col-lg-6″ height=”300″ filter-subscriber-
for=”fromTime|toTime|callerSite|callerDeviceType|receiverDeviceType|targetType” chart-options-builder=”BaseChartOptionsBuilder” chart-options-
source=”assets/chart_options/alcoholProductConsumptionSummary.json” analytics-data-source=”assets/test_resource/alcohalProductConsumption.json” type=”chart”/>
</va-widgets-container>
</va-dashboard>
Chartoptions
{
“status”: “success”,
“data”: {
“size”: {
“height”: 280
},
“barWidth”: 0.8,
“commonAxisSettings”: {
“grid”: {
“visible”: true,
“color”: “#dddddd”,
“opacity”: 0
}
},
“commonSeriesSettings”: {
“argumentField”: “age”,
“type”: “stackedbar”,
“label”: {
“visible”: true
},
“opacity”:1
},
“series”: [
{
“valueField”: “chewingTobacco”,
“name”: “Chewing tobacco”,
“color”: “#EEE8AA”,
“opacity”: 0,
“hoverStyle”: {
“hatching”: {
“opacity”: 0,
“color”: “#EEE8AA”
}
}
},
{
“valueField”: “khaini”,
“name”: “khaini”,
“color”: “#DF8F8F”,
“opacity”: 0,
“hoverStyle”: {
“hatching”: {
“opacity”: 0,
“color”: “#DF8F8F”
}
}
},
{
“valueField”: “gutkha”,
“name”: “gutkha”,
“color”: “#87CEEB”,
“opacity”: 0,
“hoverStyle”: {
“hatching”: {
“opacity”: 0,
“color”: “#87CEEB”
}
}
},
{
“valueField”: “panmasala”,
“name”: “panmasala”,
“color”: “#87CEAB”,
“opacity”: 0,
“hoverStyle”: {
“hatching”: {
“opacity”: 0,
“color”: “#87CEEB”
}
}
}
],
“argumentAxis”: {
“title”: {
“text”: “Age group”,
“font”: {
“family”: “Palatino Linotype”,
“weight”: 400,
“size”: 12
}
}
},
“valueAxis”: {
“title”: {
“text”: “# of users”,
“font”: {
“family”: “Palatino Linotype”,
“weight”: 400,
“size”: 14
}
}
},
“legend”: {
},
“tooltip”: {
“enabled”: true,
“location”: “edge”
},
“redrawOnResize”: true
}}
APPENDIX B: PUBLICATION DETAILS
The research work is presented the conference held on 17th & 18th March 2017.The paper is accepted. The paper ID: IEEES423 is published in volume-2 of the 2017 International Conference on Innovations in Information, Embedded and Communication systems.


REFERENCES
- Dr. Saravana Kumar,Eshwari T, Sampath “Predictive Methodology for Diabetic Data
Analysis in Big Data” 2nd International Symposium on Big Data and Cloud Computing,2015 elsevier
- Mimoh Ojha , Dr. Kirti Mathur “Proposed Application of Big Data Analytics in
Healthcare at Maharaja Yeshwantrao Hospital” 2016 3rd MEC international conference on Big data and Smart city
- M Archana Bakare, Prof. R.V.Argiddi, “Prediction of Diseases using Big Data Analysis” Vol. 4, Issue 4, April 2016, IJIRCCE
- Kiran J Waghmare “Prediction of Occurrence of Non-Communicable Diseases
Depending on lifestyle Habits using clustering data mining technique.”ERCICA 2013, Elseiver
- Sudha Ram, Member, IEEE, Wenli Zhang, Max Williams, and Yolande Pengetnze
“Predicting Asthma-Related Emergency Department Visits Using Big Data” Ieee Journal Of Biomedical And Health Informatics, Vol. 19, No. 4, July 2015
- Wullianallur Raghupathi and Viju Raghupathi, “Big data analytics in healthcare: promise and potential.” Health Information Science and Systems 2014
[7]. Muni Kumar and Manjula R, “Big Data Analytics in Rural Health Care – A Step towards Svasth Bharath“, International Journal of Computer Science and Information Technologies, Vol. 5 (6), 2014, 7172-7178, ISDN 0975-6946, 2014.
[8]. Andrew Pearson, Qualex Asia, “Predictive Analytics for the Healthcare Industry”, Andrew Pearson, Qualex Asia Limited, 2012.
- “Non-Communicable Disease Risk Factors Survey (2007 – 2008)”, Ministry of Health & Family Welfare, Government of India, 2009.
- RovinaDbritto, AnuradhaSrinivasaraghavan, ―Comparative Analysis of Accuracy on Heart Disease Prediction using Classification Methods
[11].Lemke F, Mueller J-A. ―Medical data analysis using selforganizing data mining technologies‖,SystemsAnalysisModeling Simulation. 2003;43(10):1399–408.
- “International Diabetes Federation. Diabetes Atlas” 3 ed. Brussels: International Diabetes Federation; 2006.
- Anderson, G.F., Chu, E. “Expanding priorities–confronting chronic disease in countries with low income”. The New England Journal of Medicine, vol.356, pp: 209-211, 2007.
- Ms. Ishtake S.H , Prof. Sanap S.A. “Intelligent Heart Disease Prediction System Using Data Mining Techniques”, “International J. of Healthcare & Biomedical Research,” Volume:
1, Issue: 3, April 2013.
- Chaitrali S. Dangare Sulabha, “ Improved Study of Heart Disease Prediction System using Data Mining Classification Techniques”, International Journal of Computer Applications (0975 – 888) Volume 47– No.10, June 2012.
- Jyoti Soni, Ujma Ansari, Dipesh Sharma, “Predictive Data Mining for Medical
Diagnosis: An Overview of Heart Disease Prediction”, International Journal of Computer Applications (0975 – 8887) Volume 17– No.8, March 2011.
- AH Chen, SY Huang, PS Hong, CH Cheng, EJ lin, “HDPS : Heart Disease Prediction
System, Computing in cardiology”, 2011 : 38:557-560.
Cite This Work
To export a reference to this article please select a referencing stye below:
Related Services
View all


Related Content
All TagsContent relating to: "Medicine"
The area of Medicine focuses on the healing of patients, including diagnosing and treating them, as well as the prevention of disease. Medicine is an essential science, looking to combat health issues and improve overall well-being.
Related Articles

DMCA / Removal Request
If you are the original writer of this dissertation and no longer wish to have your work published on the UKDiss.com website then please: