Are All Sharks Equally Vulnerable to Anthropogenic Disturbances and Therefore Equally Vulnerable to Extinction?
Info: 15904 words (64 pages) Dissertation
Published: 15th Feb 2022
Abstract
Sharks consist of many of the oldest and most diverse species within our oceans, arising 420 million years ago. They consist of the slowest maturing and slowest reproducing species, displaying long gestation periods and slow growth. Because of these extreme life histories, many Chondrichthyans species are highly sensitive to increased mortality caused by anthropogenic disturbances. The conservation of these species is vitally important, and targeted efforts must be used to conserve these species. For this to be achieved, the life histories of elasmobranchs and whether these alter the effects of anthropogenic disturbances must be better understood. The life history traits of 475 species of shark were analysed throughout this report. No significant trends were found during data analysis, suggesting that the different life history traits analysed did not alter species vulnerability to anthropogenic disturbances. However, data was found to be lacking for many species, with 42% of shark species classed as Data Deficient.
Additionally, many categorized species which did not sufficient data for analysis of all life history traits. Whilst no significant trends were found, supporting literature was found that suggested that maximum total length can be used to analyse the potential threat species may face. All other life history traits were found to be non-significant, with little to no supporting literature available. This suggests that while most life history traits will not aid in understanding species vulnerability, there may be some that do; however due to inadequate data, it is impossible to establish which life history traits these are.
The main threat the shark species is overfishing, therefore the best way to establish the level of threat species are facing, is to determine the impact that fisheries are having. This includes the impact on target species and on species caught as bycatch.
Introduction
Ecosystems provide for humanity through a variety of ways, and are comprised of a various different populations and species (Mace et al., 2005; Díaz et al., 2006). As more studies are undertaken, it has become more apparent that the impacts of the Anthropocene have greatly and permanently altered terrestrial biodiversity, with vertebrates being the most significantly affected (Schipper et al., 2008; Hoffmann et al., 2010). Some of the largest ecosystems, with the longest evolutionary histories on earth are located within our oceans. As the anthropogenic effects on terrestrial ecosystems are becoming better understood, there is rising concern as to the degree with which human influences, that have occurred over the past 500 years, are altering marine biodiversity (Jackson, 2010). At this moment in time, knowledge of changes to biodiversity in our oceans have been obtained from analyses of limited, and biased data sets, such as: commercially-important fisheries, species that inhabit coral reefs and charismatic species, (Carpenter et al., 2008; Collette et al., 2011; McClenachan et al., 2012; Ricard et al., 2012). Even with the limitations of these biased data sets, the increasing rates at which fisheries are expanding and the global trade of shark products are recognised as some of the principal threats to marine ecosystems (Polidoro et al., 2008; Anderson et al., 2011; McClenachan et al., 2012).
However, despite being identified as a major threat, little is understood about the extent of the impacts which fisheries have on marine species. Recent understanding of these impacts from fisheries stock assessments and ecosystem models, imply that the health of a few of these well-studied, overexploited species and ecosystems may be recovering. However, these analyses are of mainly data-rich, northern hemisphere seas (Worm et al., 2009). Furthermore, these results have been observed for 147 fish species within 295 populations, therefore does not provide an accurate representation of most the fisheries worldwide and threatened species, particularly species found in tropical regions, where there are limited data and commonly lower management (Sadovy, 2005; Newton et al., 2007; Ricard et al., 2012).
Sharks are some of the oldest marine species, arising at least 420 million years ago, rapidly occupying higher tiers of the marine trophic levels (Compagno, 1990; Kriwet et al., 2008). This lineage highly species rich in predators, playing important functional roles in the control of ecosystem structure and function (Ferretti et al., 2010; Heithaus et al., 2012; Stevens et al., 2000). Sharks consist of slow maturing and slow reproducing species, displaying long gestation periods and some of the most extensive maternal investment seen in marine species (Cortés, 2000). These extreme life histories of many shark species lead to slow population growth, resulting in extreme sensitivity to increased fishing pressures (Musick, 1999b; Cortés, 2002; García et al., 2008; Dulvy and Forrest, 2010). It has been determined that a reduction in these apex predators may lead to trophic cascades, that could modify the structure of many populations and ecosystem processes (Carpenter and Kitchell 1993, Schindler et al. 1997).
Furthermore, it has been established that fisheries incidentally catch many species in addition to the target species. In some cases, fisheries can capture by-catch numbers five times larger than the numbers of target species, for example, trawl net fisheries; Alverson et al. 1994). It was estimated by Alverson et al. (1994) that the global rejection of by-catch is greater than 27 x 106 Mt. per year, greater than 30% of the annual catch by marine fisheries (National Research Council 1998). Consequently, the effects of the intense harvesting of these apex predators, and of by-catch on ecosystem processes remains largely unknown for most large pelagic ecosystems (García et al., 2008).
Sharks are regularly caught by accident; however, they are regularly kept as valued bycatch (Stevens et al., 2005) as fisheries often target and species at high trophic levels (Pauly et al. 1998). Fishing pressures on shark are mounting as target populations of large teleost fishes are depleting. Also, chondricthyans are increasingly being targeted, due to their meat, livers, fins, and gill rakers being high in value (Fowler et al., 2002; Clarke et al., 2006; Lack and Sant, 2009). Shark fins have become one of the most valuable seafood commodities, with estimations that fins of 26 to 73 million individuals, worth US $400 to 550 million, are traded every year (Clarke et al., 2007).
Whilst the Food and Agriculture Organization of the United Nations (FAO), reported that landings of sharks and rays have declined by 20% since their highest value in 2003, where landings were worth US$1 billion (Musick and Musick, 2011), true total catch is likely to be 3 to 4 times larger (Clarke et al., 2006; Worm et al., 2013). Chondrichthyan catches are mostly unregulated and species are regularly misidentified, aggregated, unrecorded or discarded at sea. This results in little species-specific landings information (Barker and Schluessel, 2005; Clarke et al., 2006; Iglésias et al., 2010; Bornatowski et al., 2013). Thus, the FAO can only be optimistic that the decline in landings is as a result of improved management rather than worldwide overfishing (FAO, 2010).
A main driver of shark fishing is the globalized fin trade. There is high demand for shark fin in Asia for shark fin soup, a traditional and expensive Chinese dish. This is a particularly profitable trade that not only deals in fins from sharks, but also from shark-like rays, remains largely unregulated. This trade occurs in 86 countries and territories, and in 2010 exported >9,500 mt of fins to Hong Kong, one of the major fin trade hubs (Dulvy, et al., 2014). The process of “finning” involves the removal of shark fins and disposing the live carcass overboard, this results in the shark being unable to swim and ultimately leads to death. There is cumulative pressure to protect sharks from finning practices. However, the ecological consequences of finning are still mostly unknown.
Additionally, habitat degradation and overfishing have resulted in great changes in marine populations (Hutchings, 2000; Lotze et al., 2006; Polidoro et al., 2012), especially elasmobranchs (Stevens et al., 2000; Simpfendorfer et al., 2002; Dudley and Simpfendorfer, 2006; Ferretti et al., 2010). However, it is not clear whether the decline of globally distributed species is reversible, or symptomatic of a reduction in plasticity and continuing accumulation of global extinction risk (Jackson, 2010; Neubauer et al., 2013).
The anthropogenic disturbances discussed have various impacts on the many species of elasmobranchs. for example, whilst many species of sharks are heavily exploited for their fins, other species are not. This may be because they are deep water species or merely because they are too small and their fins are not as valuable. Nonetheless, the level of impacts that these anthropogenic disturbances have on varying shark species must be better understood. This is because a greater understanding could lead to more targeted and more successful conservation efforts. In order to better understand what characteristics, make a species more prone to detrimental anthropogenic effects, different life history traits must be analysed.
The life history traits of a species are strongly related to the extinction risk that the species will face (Hutchings 2002). Species which have low productivity, e.g. small litter size, slow growth rate, long interbirth intervals and late sexual maturity, are less capable of compensating for increased mortality caused by human impacts, such as over-fishing and habitat degradation (Garcia et al, 2008). Therefore, these species are more vulnerable to extinction (MacArthur & Wilson 1967). The life histories of species are influenced by the energy available from the environment. This energy is allocated to a variety of different biological processes. The energy available for allocation depends ultimately on the primary productivity of the ecosystem (Arendt & Reznick 2005). Therefore habitats that have been detrimentally affected by events such as pollution will have a reduced primary production, thus leading to less energy available to high trophic species for the variety of important biological processes. This is because the strength of biological interactions depends on many ecosystem characteristics, including the physical structure of the habitat (Gotceitas & Colgan 1989; Almany 2004) and the diversity of the ecosystem within (Sinclair et al. 2003; Duffy & Stachowicz 2006).
It is possible to evaluate the potential susceptibility species may face by analysing the International Union for Conservation of Nature (IUCN) Red List. The IUCN Red List was initiated in 1964, and is the most comprehensive record of the global conservation status of biological species. The IUCN Red List has precise predetermined criteria to assess the risk of extinction that thousands of species and subspecies face. These criteria are applicable to all species, in all geographical regions. The objective of the IUCN Red List is to convey the significance of the conservation of these species to the public and to policy makers, whilst also aiming to help the international community to reduce species extinction rates. The IUCN attempts to re-evaluated the category of every species every five years, or at least every ten years. This is done through peer reviewing through the IUCN Species Survival Commission (SSC) Specialist Groups. Species are classified by the IUCN Red List into nine distinct categories (IUCN, 2012) using criteria such as population size, rate of decline, geographic distribution, and the amount of population and distribution fragmentation present. The IUCN Red List categorises are as follows;
Not evaluated (NE) – This is when species have not yet been evaluated against the set criteria;
Data deficient (DD) –where there is not enough data to make an informed assessment of a species risk of extinction;
Least concern (LC) – here is when species face the lowest risk, and do not qualify for a higher at-risk category, widely distributed and abundant taxa are often included in this category;
Near threatened (NT) – when there is the potential for species to become endangered in the near future;
Vulnerable (VU) – where there is a high risk of species facing endangerment in the wild;
Endangered (EN) – this is when there is a high risk of species facing extinction in the wild;
Critically endangered (CR) – when there is an extremely high risk of species facing extinction in the wild;
Extinct in the wild (EW) – where species are only known to survive in captivity; and finally,
Extinct (EX) – where no known individuals remain.
If trends in susceptibility can be found within the life history parameters of sharks, then it may be possible to not only create targeted plans, but also this may aid in pre-emptive efforts for new species discovered.
Hypothesis, Justification and Rationale
It is hypothesised that species with K selected life history traits will be more vulnerable to anthropogenic disturbances. K selected life history traits include large organism size, few offspring, late maturation and long life expectancy. These life history traits make them more vulnerable because populations will be less resilient to detrimental anthropogenic activities such as fisheries. Therefore, each life history trait will be analysed separately, with a total of 7 individual hypotheses analysed.
Hypothesis 1: Maximum size will increase with IUCN category. It is hypothesised that larger species will be more threatened because they will be more readily targeted by fisheries. Many large species such as the blue shark (Prionace glauca) and the short-finned mako (Isurus oxyrinchus) are targeted by fisheries, as their fins are highly valued. Smaller species of shark such as the Ornate Wobbegong (Orectolobus ornatus) are less targeted, and therefore due to less pressure from anthropogenic disturbances be less threatened.
Hypothesis 2: Distribution will decrease as IUCN Red List Category increases. This is hypothesised as it is likely that species that are restricted to a smaller geographical location will be more heavily impacted by anthropogenic disturbances such as habitat loss, overfishing and pollution. Species with larger distributions will be less restricted, therefore if their habitat degrades, there is the possibility of relocation.
Hypothesis 3 and 4: Maturation length (cm) will increase with IUCN Red List category. This is hypothesised for two different reason. Primarily, larger species tend to have a larger maturation length, As previously stated, it is believed that larger species will be more heavily targeted by fisheries. Additionally, as these larger species are already a target, there is a high possibility that many of the individuals that are caught will be immature. This in turn will lead to the population being more heavily threatened, because as the number of individuals that would be reproductively viable reduces, numbers in the next generation will decrease. This will lead to a severe reduction in population. This hypothesis will be investigated in two distinct parts. Male and female maturation length will be analysed as separate hypotheses.
Hypothesis 5: Average Annual Fecundity will decrease with IUCN Red List category: The fecundity of species is hypothesised to greatly impact the ability with which that species is able to adjust to changing environments and increased selective pressures, as a low annual fecundity results in a decreased ability for a species to compensate for decreasing population size. It is therefore hypothesised that species with lower annual fecundity will be more greatly impacted by anthropogenic disturbances and therefore will be more greatly threatened.
Hypothesis 6: Birth Size (cm) will increase as IUCN Red List Category increases. Species of sharks which are smaller in size will be less affected by anthropogenic disturbances. For example, they will be more easily able to fit through fishing nets, therefore less likely to be caught as bycatch for fisheries. As well, a smaller size means that they are less likely to be targeting by the finning industry, as their fins will be less valuable. These factors make it likely that as birth size increases, species will be more readily affected by the many anthropogenic disturbances, therefore more threatened.
Hypothesis 7: Gestation Period (months) will increase with IUCN Red List Category: sharks are some of the slowest reproducing vertebrates in the marine environment, displaying extensive gestation periods and some of the highest levels of maternal investment (Cortés, 2000). These extreme life histories result in low population growth rates, meaning sharks are incredibly sensitive to increased fishing mortality. It is therefore hypothesised that gestation period will increase as IUCN Red List category increases. As this slow life history tendency makes sharks vulnerable to anthropogenic disturbances, it is believed that the longer the gestation period, the more difficult it will be for species to accommodate increasing anthropogenic pressures.
Methodology
Data used in analyses were collected from the IUCN Red List and FishBase. If parameter values were specified by a range, the maximum value was used in the analyses. If multiple values were provided for one species, i.e. where species are widely distributed and differences are found within populations, the maximum values for each population were averaged and this single value used. Data were obtained for maximum length using estimates of maximum total length, these were either the largest specimen found in the wild or in captivity for more rare species. Length at maturity for male and female specimens, fecundity, birth size and gestation period were also collected from previously published studies, and maximum values provided were used. Species distribution was calculated by recording the number of International Hydrographic Organisation (IHO) Sea Areas species inhabited, data was not obtained from previous publications. In some cases, total maximum length was given for individual’s sexes, here maximum value was used, and sex was ignored. Additionally, some species provided length at maturity for both sexes combined. In these cases, values were used for both genders. In a few cases, varying parameter estimates of the same species were provided from different sources; in these cases, maximum estimates were combined and an average value for the species was recorded.
Relationships between IUCN Red List category and life history traits were analysed: IUCN Red List category was used as the independent variable in each analysis. It was found that out of the 475 species analysed, 202 species (42%), were classed as Data Deficient. Whilst data were recorded for Data Deficient species, these values were not analysed, as not enough information was available for sufficient analyses. Data were tested for normality and homogeny of variance. ANOVA and Kruskal-Wallis analyses were then used where appropriate.
Results
Hypothesis 1: More severely threatened species will have a larger maximum size.
Table 1. Levene’s Test output. Both mean and median values of groups were tested. Mean: df = 4, p =
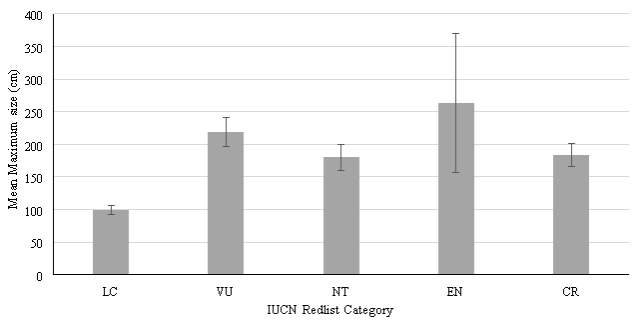
Figure 1. Relationship between Mean Maximum Length (cm) and IUCN Red List category. Data for males and females have been collated. Error bars show standard error
| Levene’s Test Output | |||||
| Levene Statistic | df1 | df2 | Sig. | ||
| Maximum Size (cm) | Mean | 11.170 | 4 | 256 | |
| Median | 5.143 | 4 | 256 | ||
| Kruskall Wallis Output | |
| Maximum Size (cm) | |
| Chi-Square | 52.79 |
| df | 4 |
| Significance | |
Table 2. Kruskal Wallis Test output. Grouping Variable: Redlist Category. Chi-squared value = 52.79, df = 4, p =
Table 3. Results of Mann-Whitney U Test. Significance was found for four of the seven tested pairs
| Mann Whitney U Output | ||
| Groups | Mann-Whitney U | Significance |
| LC vs VU | 1373.00 | |
| VU vs NT | 1078.50 | 0.12 |
| EN vs CR | 47.00 | 0.17 |
| LC vs NT | 2025.00 | |
| LC vs EN | 699.00 | |
| LC vs CR | 121.50 | |
| VU vs CR | 179.00 | 0.91 |
Reliable data were available for a total of 181 species of sharks. No trend of increasing maximum length was observed as had been hypothesised (Figure 1). Peak values of mean maximum length were observed for Vulnerable species (281.45cm) and Endangered species (263.31cm). A standard error of 22.44 was calculated for Vulnerable species, with a range between values of 626.3 cm. A standard error of 106.98 was calculated for Endangered species, with a range between values of 1966cm, the largest values calculated within the data set. The smallest mean maximum length calculated was observed for species of Least Concern (92.23cm). A standard error of 7.28 was calculated, with a range between values of 595 cm. A mean maximum length of 179.91cm was calculated for Near Threatened species. A standard error of 19.84 was calculated, with a range between values of 705 cm. A value of 183.13cm was calculated for mean maximum length for Critically endangered species. A range of 151 cm was calculated for species of this category, and the standard error was found to be 17.62.
To test for differences in mean maximum length (cm) between each IUCN Red List category, a Kruskal-Wallis test was undertaken, with results shown in Table 2 (p=
A p value of Least concern species and Near Threatened species, with a p value of Least concern species and Endangered species, therefore significant difference between the maximum size (cm) of species within these two groups is present. Significant difference was found between the maximum size (cm) of Least Concern species and Critically Endangered species, with p = 0.05.
From analysing the output of the post-hoc tests, the hypothesis that maximum size (cm) will increase with IUCN Red List Category must be rejected, as significant differences were only found when comparing maximum size of Least Concern species to other groups, no other significance was found.
Hypothesis 2: Distribution will decrease as IUCN Red List Category increases.
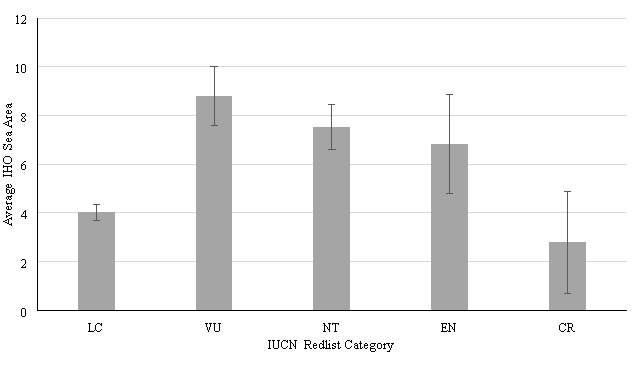
Figure 2. Average IHO Sea Area inhabited against IUCN Redlist Category. Error Bars show Standard Error. Mean values: LC = 4.04, VU = 8.80, NT = 7.53, EN = 6.83, CR = 2.10. Standard Error values: LC = 0.33, VU = 1.20, NT = 0.93, EN = 2.04, CR = 2.80.
Table 4. Output values of Kruskal-Wallis test. Grouping variable = IUCN Red List category. Chi-squared value = 21.94, df = 4, p =
| Kruskal-Wallis Output | |
| IHO Sea Area Inhabited | |
| Chi-Square | 21.94 |
| df | 4 |
| Significance | |
Table 5. Output values of Mann-Whitney U post hoc test. Significance was found for 4 out of the 10 comparisons
| Mann-Whitney U Output | ||
| Categories | Mann-Whitney U | Significance |
| LC vs VU | 2299.00 | |
| LC vs NT | 2634.50 | |
| LC vs EN | 1215.00 | >0.05 |
| LC vs CR | 572.00 | >0.05 |
| VU vs NT | 1306.50 | >0.05 |
| VU vs EN | 334.00 | >0.05 |
| VU vs CR | 135.00 | |
| NT vs EN | 372.50 | >0.05 |
| NT vs CR | 139.50 | |
| EN vs CR | 79.00 | >0.05 |
Reliable data were available for a total of 273 species of sharks, where data on distribution could be calculated. No decreasing trend of distribution with IHO Sea Area was observed as had been hypothesised (Figure 2). Peak value of mean IHO Sea areas inhabited was observed for Vulnerable species (8.80) A standard error of 1.20 was calculated for Vulnerable species, with a range between values of 31. The smallest value calculated for mean IHO Sea Areas inhabited was observed for Critically Endangered species, with a calculated mean of 2.8. A range of 23 was calculated for species of this category, and the standard error was found to be 2.10. A value of 4.04 was observed for the mean number of IHO Sea categories inhabited by species of Least Concern. A standard error of 0.33 was calculated, the smallest calculated value with a range between values of 25. The mean value of inhabited IHO sea areas for Near Threatened species was calculated as 7.53. A standard error of 0.93 was calculated, and a range of 34 was calculated for this category. A mean value of IHO Sea areas inhabited of 6.83 was calculated for Endangered species. A standard error of 2.04 was calculated for this category, with a range between values of 23.
A Kruskal-Wallis test was performed on the data set. The grouping variable was IUCN Red List Category. Output results of Kruskal-Wallis test are show in Table 4. The results show a p value of 0.05, and therefore no other significant relationships are found within this data set. Whilst there is minimal significance in this data set, it can be seen in Figure 3 that there is a non-significant decreasing trend when comparing the distribution of Vulnerable, Near Threatened, Endangered and Critically Endangered species. However, the hypothesis that distribution will increase with IUCN Red List category must be rejected.
Hypothesis 3: Mean female maturation length (cm) will increase with IUCN Red List category
Figure 3. Box plot of Female maturation length (cm) against IUCN Red List category. Anomalous results are marked by an asterisk.
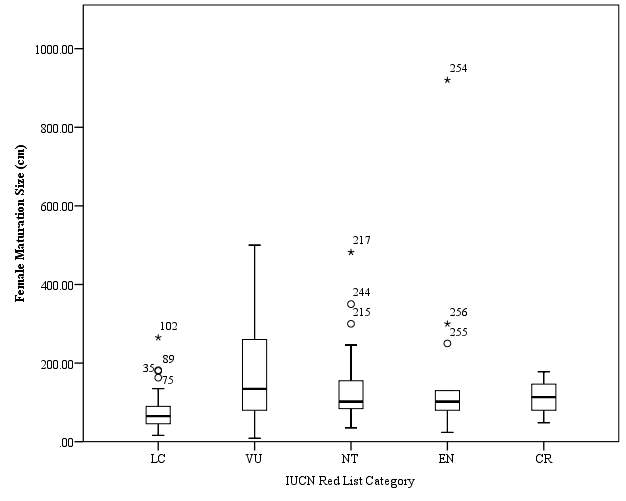
Table 6. Output of results of Kruskal-Wallis test. Results showed that significant difference was present within the data set, (p =
| Kruskal-Wallis Output | |
| Female Maturation Size (cm) | |
| Chi-Square | 50.966 |
| df | 4 |
| Significance | |
| Mann-Whitney U Output | ||
| Comparison Pairing | Mann-Whitney U | Significance |
| LC vs VU | 590.00 | |
| LC vs NT | 940.50 | |
| LC vs EN | 284.50 | |
| LC vs CR | 170.00 | |
| VU vs NT | 574.50 | >0.05 |
| VU vs EN | 185.5 | >0.05 |
| VU vs CR | 91.50 | >0.05 |
| NT vs EN | 269.00 | >0.05 |
| NT vs CR | 170.50 | >0.05 |
| EN vs CR | 51.50 | >0.05 |
Table 7. Output of results of Mann-Whitney U post hoc tests. Results showed 4 comparison pairs to have significant difference, while 6 groups did not.
Female maturation length data were available for a total of 195 species of sharks. No trend of maximum maturation length was observed as had been hypothesised (Figure 3). The mean for maximum maturation length of Vulnerable species was calculated to be 177.29cm. A standard error of 19.63 was calculated for this category, with a range between values of 491cm. The mean value calculated for maximum maturation length for Critically Endangered species was 113.2cm, the smallest range calculated within this data set. A range of 130cm was calculated for species of this category, and the standard error was found to be 16.20. The mean for maximum maturation length of Least Concern species was calculated to be 71.01cm. A standard error of 3.92 was calculated, the smallest standard error observed within this data set. The range between values was calculated to be 249cm. The mean value of maximum maturation length for Near Threatened species was calculated as 134.22cm. A standard error of 13.60 was calculated, and a range of 447cm was calculated for this category. Peak mean value of maximum maturation length was observed for Endangered species (183.20cm). A standard error of 64.80 was calculated for this category, the largest calculated value, and a range of 896cm was calculated, the largest range calculated. A Kruskal-Wallis test was performed on the data set, and a significant difference was found (p =
Mann-Whitney U tests were then performed to establish where the significant differences were found. The outputs of the Mann-Whitney U tests are shown in Table 7. Four out of then ten comparison pairs were found to have significant difference, (LC vs VU = 0.05, VU vs EN = >0.05, VU vs CR = >0.05, NT vs EN = >0.05, NT vs CR = >0.05, EN vs CR = >0.05. No significant trend was shown between the IUCN Red List categories, therefore the hypothesis that mean Female maturation size increases with IUCN Red List category must be rejected.
Hypothesis 4: Mean male maturation length (cm) will increase with IUCN Red List category
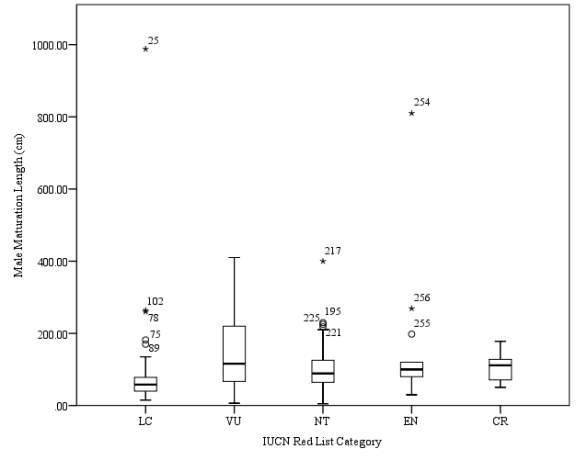
Figure 4. Box plot of male maturation length (cm) against IUCN Red List category. Anomalous data points are marked by asterisks.
| Kruskal-Wallis Output | |
| Male Maturation Length (cm) | |
| Chi-Square | 52.04 |
| df | 4 |
| Significance | |
Table 8. Output of results of Kruskal-Wallis test. Results showed that significant difference was present within the data set, (p =
Table 9. Output of results of Mann-Whitney U post hoc tests. Results showed 4 comparison pairs to have significant difference, while 6 groups did not.
| Mann-Whitney U Output | ||
| Comparison Pairing | Mann-Whitney-U | Significance |
| LC vs VU | 955.00 | |
| LC vs NT | 1668.50 | |
| LC vs EN | 305.50 | |
| LC vs CR | 183.50 | |
| VU vs NT | 750.00 | >0.05 |
| VU vs EN | 234.50 | >0.05 |
| VU vs CR | 124.50 | >0.05 |
| NT vs EN | 269.00 | >0.05 |
| NT vs CR | 175.00 | >0.05 |
| EN vs CR | 50.50 | >0.05 |
Male maturation length data were available for a total of 344 species of sharks. No trend of maximum maturation length was observed as had been hypothesised (Figure 4). The mean for maximum maturation length of Vulnerable species was calculated to be 146.26cm. A standard error of 15.52 was calculated for this category, with a range between values of 403.5cm. The mean value calculated for maximum maturation length for Critically Endangered species was 106.175cm, the smallest range calculated within this data set, with a range of 127.6cm calculated within species of this category, and the standard error was found to be 14.73. Peak mean value for maximum maturation length of Least Concern species was calculated to be 71.02cm. A standard error of 8.33 was calculated, the smallest standard error observed within this data set. The range between values was calculated to be 973cm, the largest range calculated within this data set. The mean value of maximum maturation length for Near Threatened species was calculated as 106.42cm. A standard error of 11.45 was calculated, and a range of 395cm was calculated for this category. A mean value of maximum maturation length of Endangered species was calculated to be 164.6cm. A standard error of 54.43 was calculated for this category, the largest calculated value within this data set, and a range of 780.2cm was calculated.
A Kruskal-Wallis test was performed on the data set. The output results of Kruskal-Wallis test are show in Table 8. The results show a p value of
4 out of the 10 pairs tested were found to be significant. A p value of
The final pairing to show significant difference was Least Concern species and Critically Endangered species (p = 0.05, VU vs EN = >0.05, VU vs CR = >0.05, NT vs EN = >0.05, NT vs CR = >0.05, EN vs CR = >0.05. No significant trend was shown between the mean male maturation size (cm) for each IUCN Red List category, therefore the hypothesis that mean male maturation size (cm) increases with IUCN Red List category must be rejected.
Hypothesis 5: Average Annual Fecundity will decrease with IUCN Red List category
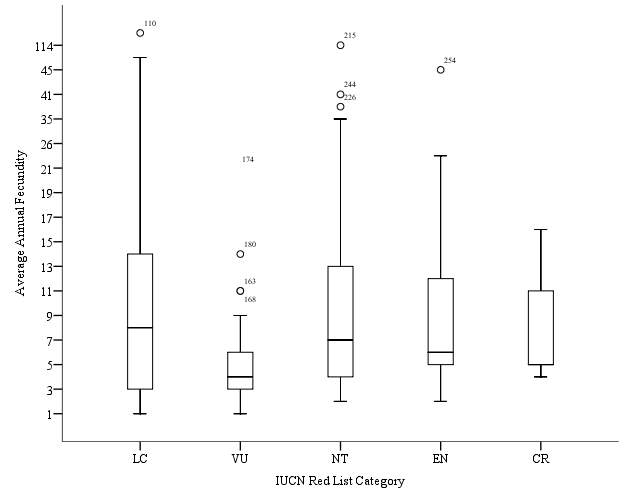
Figure 5. Box plot of average annual fecundity against IUCN Red List category.
Table 10. Output of results of Kruskal-Wallis test. Results showed that no significant difference was present within the data set, (p = >0.05).
| Kruskal-Wallis Output | |
| Average Annual Fecundity | |
| Chi-Square | 3.658 |
| df | 4 |
| Significance | .454 |
Data on annual fecundity were available for a total of 160 species of sharks. No trend of decrease in average fecundity was observed as had been previously hypothesised (Figure 5). The mean for the annual fecundity of Vulnerable species was calculated to be 7.11. A standard error of 1.07 was calculated for this category, the smallest calculated within this data set. A range between values of 32.5 was calculated for this category. The mean value calculated for annual fecundity for Critically Endangered species was 8.33, the lowest annual fecundity calculated. The smallest range calculated was found within this data set, with a range of 12 calculated within species of this category, and the standard error was found to be 3.84. The mean value for annual fecundity of Least Concern species was calculated to be 11.41. A standard error of 1.82 was calculated for this category. The range between values was calculated to be 114. The mean value of annual fecundity for Near Threatened species was calculated as 12.63. A standard error of 1.07 was calculated, and a range of 112.5 was calculated for this category. A peak mean value of annual fecundity was calculated for Endangered species, with a calculated mean of 33.73. A standard error of 22.75 was calculated for this category, the largest calculated value within this data set. The largest range within the data set was also calculated for this category, with a range of 302 being calculated.
The data set was found to be non-parametric, and was therefore tested using a Kruskal-Wallis test. The output results of Kruskal-Wallis test are show in Table 10. The results show a p value of >0.05, therefore there is no significant difference between the 5 IUCN Red List categories for mean annual Fecundity. As the data set was found to have no significance, no post-hoc test was required. No significant trend was shown between the mean annual fecundity for each IUCN Red List category, therefore the hypothesis that mean annual fecundity will decrease with IUCN Red List category must be rejected, however overall a non-significant decrease can be seen, as shown in Figure 5.
Hypothesis 6: Birth Size (cm) will decrease as IUCN Red List Category increases
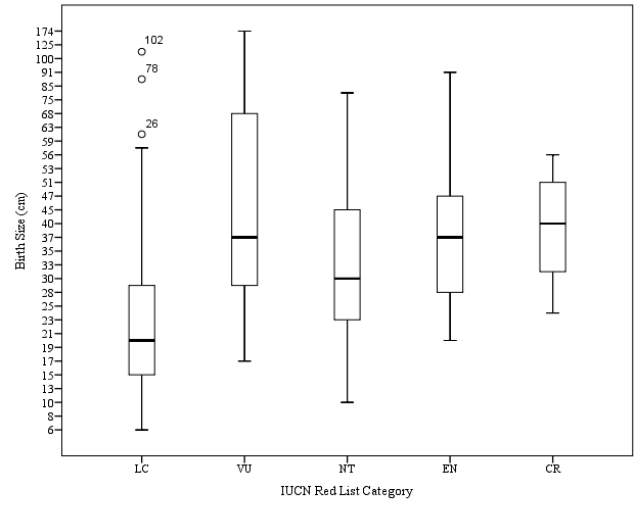
Figure 6. Relationship between birth size (cm) and IUCN Red List Category
Table 11. Output for Kruskal-Wallis test. Results were found to be significant (p =
| Kruskal-Wallis Output | |
| Birth Size (cm) | |
| Chi-Square | 39.38 |
| df | 4 |
| Significance | |
Table 12. Output of Mann-Whitney U post hoc test
| Mann-Whitney U Output | ||
| Comparison Pairs | Mann-Whitney U | Significance |
| LC vs VU | 504.50 | |
| LC vs NT | 1208.50 | |
| LC vs EN | 170.50 | |
| LC vs CR | 142.50 | >0.05 |
| VU vs NT | 569.00 | |
| VU vs EN | 183.00 | >0.05 |
| VU vs CR | 70.50 | >0.05 |
| NT vs EN | 218.50 | >0.05 |
| NT vs CR | 144 | >0.05 |
| EN vs CR | 27.50 | >0.05 |
Reliable data on birth size (cm) were available for a total of 181 species of sharks. No trend of decrease in birth size (cm) was observed as had been hypothesised (Figure 6). A peak mean value for birth size (cm) of Vulnerable species was calculated to be 53.62cm. A standard error of 6.57 was calculated for this category. A range between values of 172.5cm was calculated for this category, the largest calculated within this category. The mean value calculated for birth size (cm) of Critically Endangered species was 32.33cm. A range of 45.6cm was calculated within species of this category, and the standard error was found to be 6.69, the highest value for standard error calculated within this category. The mean value for birth size (cm) of Least Concern species was calculated to be 23.45cm, the lowest calculated value within this data set. A standard error of 1.86 was calculated for this category, the lowest standard error calculated for this data set. The range between values was calculated to be 106.3cm. The mean value of birth size (cm) for Near Threatened species was calculated as 33.12cm, the largest value for mean birth size out of the 5 categories analysed. A standard error of 2.64 was calculated, and a range of 71.7cm was calculated for this category. The mean value of birth size (cm) was calculated for Endangered species was calculated to be 41.00cm. A standard error of 5.73 was calculated for this category, and a range of 71.00 cm was calculated.
Significant difference between birth size of sharks was found (p=
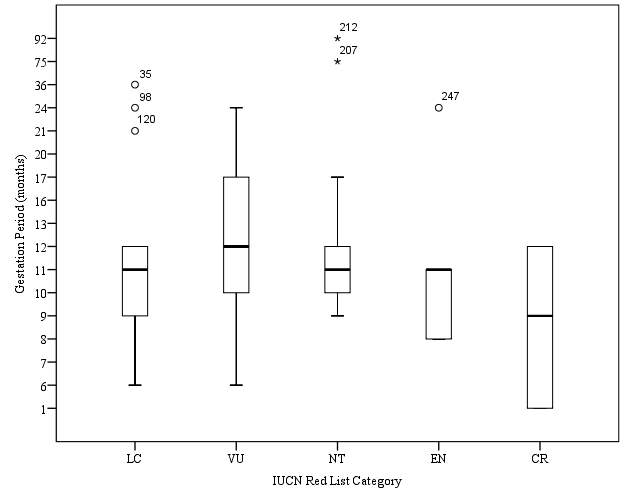 Hypothesis 7: Gestation Period (months) will increase with IUCN Red List Category
Figure 7. Relationship between gestation period (months) and IUCN Red List Category
| Kruskal-Wallis Output | |
| Gestation Period (months) | |
| Chi-Square | 4.031 |
| df | 4 |
| Significance | .402 |
Table 13. Output of results of Kruskal-Wallis test. Results showed that no significant difference was present within the data set, (p = >0.05).
Reliable data on gestation period (months) were available for a total of 94 species of sharks, the smallest amount of data available of all life history traits analysed. No trend of increase in gestation period (months) was observed as had been previously hypothesised (Figure 7). The mean value for gestation period (months) of Vulnerable species was calculated to be 13.02 months. A standard error of 1.09 was calculated for this category. A range between values of 18 months was calculated for this category. The mean value calculated for gestation period of Critically Endangered species was 8.16 months, the lowest calculated value within this data set. A range of 11 months was calculated within species of this category, and the standard error was found to be 3.59. The mean value for gestation period of Least Concern species was calculated to be 11.18 months. A standard error of 0.90 was calculated for this category, the lowest standard error calculated for this data set. The range between values of this category was calculated to be 32.06 months. A mean value of gestation period (months) for Near Threatened species was calculated as 21.84 months, the largest value for mean birth size out of the 5 categories analysed. A standard error of 6.27 was calculated, the largest standard error calculated within this data set. Additionally, the largest range was within this data set was calculated for this category, with a range of 122.7 months. The mean value of gestation period (months) was calculated for Endangered species was calculated to be 11.64 months A standard error of 2.11 was calculated for this category, and a range of 716 months was calculated.
The data set was tested using a Kruskal-Wallis test. The output results of Kruskal-Wallis test are show in Table 13. The results show a p value of >0.05, therefore there is no significant difference between the 5 IUCN Red List categories for gestation period (months). As the data set was found to have no significance, no post-hoc test was required. No significant trend was shown between the gestation period (months) for each IUCN Red List category, therefore the hypothesis that Gestation period will increase with IUCN Red List category must be rejected. Data set was graphically summarised in Figure 7.
Discussion
Hypothesis 1: More severely threatened species will have a larger maximum size
There was no evidence suggesting that more severely threatened species will have a larger maximum size. Whilst significant difference was found between some categories, no significant trend was present within the data set. Whilst these results meant that the proposed hypothesis could not be accepted, ecological theory and supporting data suggests that species with r selected histories will be more likely to successfully recover from anthropogenic disturbances. However, species with k selected life histories, such as long-lived species which demonstrate slow growth rates, and attain large body sizes, are associated with low maximum rates of population growth. These species are therefore inherently more vulnerable to anthropogenic disturbances, and therefore more vulnerable to extinction (Pimm et al., 1988; Reynolds, 2003).
Research into the effects of maximum length of sharks on vulnerability to anthropogenic disturbances has been minimal, however, there is evidence from analyses of bird and mammal species that supports the hypothesis that large-bodied species will be more vulnerable to extinction. Olden, et al (2007) carried out research into size biased extinction risks on marine and freshwater fishes. A total of 12,477 species of marine fish were analysed in this report, with body size data collected from FishBase. It was found that large bodied marine fish were at most risk of global extinction, with evidence that large marine fish species were disproportionately threatened by commercial large-scale fisheries due to selective fishing processes (Dulvy et al., 2003).
As Chondricthyans i.e. sharks, skates and rays, are examples of large-bodied fishes which were found to show a greater vulnerability to over-fishing and to have have limited capability to recover from detrimental anthropogenic disturbances (Jennings et al., 1998; Musick et al., 2000; Hutchings & Reynolds, 2004), it can be determined that whilst the results in this thesis do not support the hypothesis, there is evidence that suggests that maximum size does affect shark vulnerability to anthropogenic disturbances (Olden, J. D. et al., 2007)
As over-exploitation of larger species of shark has increased, shifts in length compositions to smaller sizes have been recorded in several species (Anderson, 1985; Walker and Heessen, 1996; Rago et al., 1998). Changes in this size structure may also be as a result of size-selective properties of fishing gear used. This in turn may have significant consequences for the reproductive productivity of many species of shark, and therefore further detrimental implications may be experienced for more threatened species (Stevens, J. D. et al., 2000). There is evidence that fecundity increases with body size in many marine species. Therefore, it is possible that shark populations which possess a higher proportion of larger individuals will have greater reproductive potential. For example, litter size of the Gummy Shark (Mustelus antarcticus), increases with maternal size (Walker et al., 1998).
To reduce the effects of fisheries on population sizes, mesh size in gillnet fisheries for the Gummy Shark (Mustelus antarcticus) in southern Australia has been enlarged as a management measure, allowing a greater escapement of larger females, thus protecting the breeding stock. Walker et al. (1998) have shown that species mortality caused by length selective fishing in Gummy sharks (Mustelus antarcticus) has resulted in an apparent change in species growth rate. The gillnets that are used have the ability to cull a higher percentage of fast-growing sharks among young age classes and a higher percentage of slow-growing sharks among the older age classes. This process affects the composition of age and size among a population in multifaceted ways. Jennings and Kaiser (1998) found that fisheries mortality acts as a selective pressure and life-history traits that are inherited i.e. growth, can be anticipated to evolve if the exploitation of these species continues.
These outcomes are something that must be considered in the conservation of shark species. Whilst it has been established that larger species are more vulnerable to size-selective mortality due to fishing exploitation, many other smaller species may be greatly impacted by forced evolution. As fecundity decreases with size, if populations are forced to shift to smaller sizes to relieve the pressures of over-fishing, this could lead to a drastic reduction in fecundity amongst many species, ultimately leading to severe declines in shark populations.
It can be determined that the outcome from this report was a consequence of the data that was available for the maximum length of shark species, with data only available for 181 species of shark. Additionally, where data were available, many species provided estimates or ranges of maximum size, reducing the accuracy of the data obtained. If this study were to be carried out on a smaller sample of species, more accurate results may be able to be obtained, and therefore significant trends may have been visible for this life history trait.
Hypothesis 2: Distribution will increase with IUCN Red List Category
While no significant trend was found between distribution and vulnerability, there have been growing concerns about the impacts of the Anthropocene on the many chondrichthyan species which have restricted distributions (Last and Stevens 1994).
Several small and unusual elasmobranch species such as the whitespotted bamboo shark, Chiloscyllium plagiosum and the coral catshark, Atelomycterus marmoratus, are being targeted at increased rates for public and private aquarium. This is cause for concern in regard to species with restricted distributions and small population numbers, such as endemic species and other rare elasmobranchs. As demand for exotic fish, from public aquaria and hobbyists, increases, it is becoming increasingly important that potentially vulnerable populations of elasmobranchs are not overexploited. However, if the numbers of species taken are restricted, sharks found in public aquaria may be highly valued in regard to the education of the public, which in turn may be vital to change the negative perception of sharks shared by many of the public. This may potentially build political will to conserve them. Undoubtedly, though, the fishing of these species for display must not be allowed to threaten species survival potential in their natural environment.
Due to their life history strategies, many species of shark are extremely vulnerable to over-exploitation, often leading to the depletion of populations. Many species are more susceptible to extinction due to factors such as their constrained distribution, or dependence on specific habitats and nursery grounds. For instance, all species of sawfishes (Pristis spp.) are highly vulnerable to extinction, as they occupy habitats limited to freshwater, estuarine or shallow waters inshore, which are often subjected to vast human disturbance and exploitation. They are also extremely vulnerable to being caught as bycatch throughout all life stages. Their toothed rostrum makes sawfishes highly vulnerable to entanglement in fishing gear at all ages, and incredibly difficult to release alive, even if not targeted catch (Compagno and Cook 1995, in press d).
There are however concerns about the impacts of anthropogenic disturbances on widespread elasmobranch species as well. The propensity of the great white shark Carcharodon carcharias to explore human activities makes it extremely easy for trophy hunters to approach it (Fergusson et al. in press). It is debated that there is the potential for fisheries (or other anthropogenic factors) to exploit widespread chondrichthyans to extinction (Musick 1998). It is argued by some, that a species will become commercially extinct, where the population is so rare that it is no longer profitable to target that species, before the species becomes biologically extinct. This should therefore in theory, relieve the directed fishing pressure upon that species. Whilst this may potentially allow for targeted species to recover, it does not alter the potential impacts to species caught as bycatch. Species that are not targeted, but are found within the fishing grounds of other targeted and more abundant species will continue to be subjected to intense fishing pressures. As there is no possibility of these species becoming commercially extinct due to their lack of economic value, they will continue to be incidentally caught, potentially leading to their extinction.
It is possible that fisheries could collapse if stocks reduce to numbers so low, that they will be no longer profitable to continue. However, the idea that species will become economically extinct before facing biological extinction is not certain, in such cases where the value of the product is high enough that it is still economically viable for fisheries to continue to target extremely low stock, or where economic yield is not a controlling factor, such as recreational trophy fishing. Additionally, in mixed-species fisheries, where all targeted shark species are subjected to the same fishing effort and face similar mortality rates, species with lower population numbers exposed to fishing activity throughout their range may be driven to extinction, whereas species with higher numbers within a population may continue to sustain the fishery (Musick 1995).
Species that are caught extensively as bycatch have the potential to be, indirectly, more vulnerable than target species in a mixed fishery environment. This is as a result of discards and landings generally being poorly monitored and therefore, signs of decreasing catches and collapsing stocks have the potential to be overlooked (Camhi, M., 1998.). An example of this scenario occurring is the North-west Atlantic barndoor skate Raja laevis, a species large in size with late maturation, which was often taken as bycatch in the bottom trawl groundfish fisheries.
It was found by Casey and Myers (1998) that R. laevis appeared to have become extinct in northern Canadian waters. It currently only survives in small population numbers off Georges Bank, near the southern edge of its range, where warm water temperatures allow for faster growth and therefore it is presumed that maturation occurs earlier. Widely distributed species may suffer local depletion in some parts of their ranges, even though their global abundance may remain high. However, it is difficult to assess the cumulative effect that localised depletions will have on the viability of species at a global level, as new shark fisheries which go unregulated and unmonitored appear throughout our world’s oceans (Camhi, M., 1998).
It is argued that immigration of individuals from source populations may potentially counterbalance any observed depletions. In so doing, this may reduce the extinction risk faced by many species, however, little is known about the population structure and dynamics or the migratory behaviour of most chondrichthyan species (Camhi, M., 1998). The suggestion that elasmobranch populations are not susceptible to extinction because they are distributed across a geographic range and therefore can undertake unrestricted immigration is unsubstantiated (Camhi, M., 1998). Even the coastal stocks of large migratory elasmobranch species such as the sandbar shark (Carcharhinus plumbeus) have been shown to have discrete geographical boundaries (Musick 1995).
Data from beach netting programmes and historic cases of which have suffered from collapse, such as the North Atlantic porbeagle sharks (Lamna nasus), suggest that migration between populations, or even within a single population (i.e. when individuals often return seasonally to the same coastal habitat through their life), may be restricted. The overfishing of the common skate (Raja batis), a large and long-lived species, during this century has resulted in its extinction in the Irish Sea (Brander 1981) and the majority of the North Sea. Because the common skate is found to still occur in the nearby Celtic Sea and North-east Atlantic, but has not been recorded in landings from the Irish sea and North Sea, it has been suggested that the recovery of diminished or extirpated elasmobranch populations through local immigration is not certain, or if it does occur, is extremely slow, even if all landings were to cease. Likewise, even if fishing in the North-west Atlantic shark fishery were to completely cease, stocks of the sandbar shark (Carcharhinus plumbeus) and other large coastal elasmobranch species located in this region would take several decades to recover, due to the extremely low rate of population increase for this species (Camhi, M., 1998).
Therefore, in general, it can be established that the rate of recovery of elasmobranch populations following localised depletion is in fact species-specific. The rate of recovery will depend not only on the species’ reproductive capacity, but also on other variables such as migration patterns, the rate of population increase, the level of depletion that occurs within a population, changes in habitat that exploitation may cause, and their prey population structure (Camhi, M., 1998). Consequently, the distribution of a species does not affect how greatly it will be affected by anthropogenic disturbances, rather a multitude of other life history factors.
Hypothesis 3 and 4: Maximum maturation length (cm) will increase with IUCN Red List category for both male and female individuals
No significant trend between maximum maturation length and vulnerability were found through the data analysis performed in this report, for either males or females. This may be as a result of limited data, with data for female maturation size available for 195 species and male maturation size available for 344 species. The data available for maturation length was somewhat lacking, and where present a range of maturation lengths were provided for species. This did therefore not provide precise measurements and may have affected the results that were obtained.
In addition, it was not considered the impact that birth size would have on the data. For example, smaller species will ultimately have a lower birth size and lower maturation length, while larger species will mature at much greater lengths. It may have been more appropriate to analyse the age at which species matured, however limited data was available for this life history parameter, and therefore it was deemed inappropriate to analyse.
However, due to the findings of this report, it must be concluded that maturation length is not an appropriate life history parameter to estimate the potential vulnerability of a species to anthropogenic disturbances.
Hypothesis 5: Average Annual Fecundity will decrease with IUCN Red List category
It has been established that over-exploitation of larger species of shark has led to shifts in length compositions to smaller sizes (Anderson, 1985; Walker and Heessen, 1996; Rago et al., 1998) resulting in a diminished ability to respond appropriately to increased anthropogenic disturbances. However, no known research has been undertaken in establishing if smaller shark species will have lower annual fecundity, and therefore be less able to adapt to anthropogenic disturbances.
Data analysis of data collected showed that there is no relationship between the intrinsic vulnerability of a species and its annual fecundity, thus suggesting that fecundity has little interaction with a species ability to recover from the detrimental impacts of anthropogenic disturbances. However, data for fecundity was limited, with data only available for 160 species of the 475 species of sharks that were analysed. In addition to this, even if data were present, many species had very broad descriptions of fecundity, with many data provided being estimates of fecundity. Therefore, due to the lack of reliable data available, it must be determined that fecundity is not a life history parameter that has large effects on a species vulnerability to extinction
Hypothesis 6: Birth Size (cm) will decrease as IUCN Red List Category increases
It was hypothesised that an increase in birth size (cm) would be witnessed as the severity of vulnerability increased. It was theorised that species of sharks smaller in size will be less affected by anthropogenic disturbances such as over-fishing. The justification behind this was that smaller species of fish would be more readily able to pass through the mesh sizes of fishing nets, thus reducing the number of individuals caught as bycatch. Additionally, smaller species of shark are less valuable on the fin market, due to a reduction in the number of fin rays present. It was theorised that these smaller species would not be readily targeted and any individuals caught would be released, so as not to increase the haul weight.
However, no significant increase in birth size was witnessed in the results recorded, however a non-significant increase can be seen in Figure 6. Data were only available for 181 species out of the 475 species recorded, and may be the result for non-significant results.
Hypothesis 7: Gestation Period will increase with IUCN Red List Category
From analyses of the data available on gestation period of shark species, it was found that there is no significant difference between the gestation periods of species across the different IUCN Red List categories. There was limited data available on this life history parameter, with data available for 94 out of the 475 species analysed, the lowest data available of all life history parameters. Therefore, it could be theorised that a lack of significance within the data set was due to the limited available data.
Another potential reasoning for the results found, is that whilst it would be expected that lower fecundity would inhibit a species potential to recover from detrimental anthropogenic effects, shark species have remained relatively unchanged for 42 million years. Therefore, it can be assumed that each species has been well adapted to its evolutionary niche, and any disruption to this may have negative impacts, regardless of the number of offspring produced. However, there is no literature available to either confirm or deny this.
In addition, this analysis did not consider the impact of parental care on the results. Species with higher fecundity may produce more offspring as so to not provide as much, or any parental care towards their offspring, while larger species which produce much smaller litter sizes may have high parental investment. This in turn will affect the number of offspring which will survive to reach reproductive age, and therefore a population’s ability to recover from drastic reductions in numbers. However, due to the results of this study, it must be concluded that this life history trait will not provide an accurate estimation of the potential vulnerability a species may face.
The Impacts of Anthropogenic Disturbances on Shark Populations
It can be determined that whilst maximum size can be used to estimate the potential threat a species may face from the Anthropocene, there are many factors that play a role in the potential threat of extinction faced by many species. Whilst competition for resources and hostile environments play an important role in population dynamics, the main threat to shark species is still overfishing.
In spite of contrary perceptions, wide-ranging and highly migratory sharks still face the potential of severe threat. It has been found that globally, three-quarters of oceanic pelagic sharks face an increased risk of extinction due to overfishing (Dulvy. et al., 2008). 52% of all ocean pelagic elasmobranchs face threats from overfishing, more than double the amount of all other chondricthyans.
This highlights the intensity and widespread effort of open ocean fisheries for high valued large pelagic fishes, the absence of limits on pelagic shark catches, and the increasing value of shark fins and meat (Dulvy. et al., 2008). The area covered by fisheries has been rapidly spreading across the world’s oceans in the last 50 years, and there is a high probability that there are no more areas in our opens oceans which remain unexploited (Myers and Worm, 2003). Shark fishing continues to be unrelenting on our oceans shark species, due to the comparatively high productivity of the principal target species (Schindler et al., 2002; Sibert et al., 2006). In addition to this, the inadequate awareness of shark management is also increasing the threat that many of these species face (Lack and Sant, 2006).
The semi-oceanic hammerhead (Sphyrna spp.) is the second most common species of shark that are traded for their fins. All species account for at least 4–5% of the fins found in the Hong Kong market, resulting in an estimated annual catch of between 1.3 and 2.7 million individuals every year (Clarke et al., 2006). Despite hammerheads being moderately productive, it has been estimated that species have suffered substantial declines in population numbers in the North-West Atlantic, of up to an order of magnitude since the mid-1970s. This is one of the few areas where data are accessible to assess the status of these species (Baum et al., 2003; Myers et al., 2007). The scalloped hammerhead (Sphyrna lewini), was recently categorized as globally Endangered. Like many other fully oceanic species, very little is known about the biology, impact of fisheries and status of many semi-oceanic and oceanic sharks. For example, the bignose shark (Carcharhinus altimus) was categorized as Data Deficient globally, due to the presumption that it is often misidentified and therefore not reported worldwide (Dulvy, 2008).
This is a clear example of the main problem that was faced throughout this research project. Few species of sharks have adequate available data, and therefore an accurate analysis of the effects of life history parameters on vulnerability is an impossibility. Therefore, to provide appropriate conservation efforts, the impacts of fisheries on species must be better understood. At present research is only undertaken on species where the direct impacts of fisheries can be clearly observed.
In addition to the impacts that fisheries that have on shark populations, many shark species have a strong dependency on the ecosystem they inhabit. For example, mangroves, seagrass beds and a variety of other estuarine habitats are important breeding, nursery and foraging sites for a number of species (Heupel & Hueter, 2002; Simpfendorfer & Heupel, 2004; Heupel et al., 2007). It has been found that many species will repeatedly return to the same locations to mate, give birth or feed year after year (Hueter et al., 2005), and sharks may also rely on a specific type of habitat at specific stages in their life histories. Moreover, these habitats are important for prey species such as fishes, crustaceans, turtles and marine mammal species (Cappo et al., 1998; Carruthers et al., 2002; Nagelkerken et al., 2008) and the degradation of these habitats could potentially disturb prey availability. One of the most greatly affected ecosystems affected by human activities are coral reefs. Declines in coral reefs could significantly alter reef teleost population dynamics. As these species are often important prey for reef sharks (Munday, 2004; Bellwood et al., 2006; Munday et al., 2008), alterations in their populations may lead to drastic reductions in reef populations of sharks.
These impacts that many populations face from fisheries was not considered. The impacts of fisheries on shark populations are extensive, and the effects of these anthropogenic disturbances may have masked any relationships visible between certain life history traits and IUCN Red List category. If species had been categorised into whether their habitats fell within fisheries ground, relationships may have been visible.
While it can be argued that many of these alterations to ecosystem habitats are as a result of climate change, it must be noted that climate change does not occur as a single factor (Chin, et al., 2010). Therefore, other anthropogenic pressures such as coastal development and fishing may lead to an increase in the vulnerability of many marine species (Poulard & Blanchard, 2005; Harley et al., 2006). For example, coastal habitats found on the Great Barrier Reef are under growing pressure. Coastal development such as aquaculture, expansion of residential areas, ports, agriculture, and associated infrastructures such as roads and causeways, has led to significant changes in coastal habitats (Chin, et al., 2010). These impacts are caused by actions such as land clearing, altered hydrology, reclamation, and the disposal of pollutants such as pesticides and nutrients into marine waters, which in turn can disrupt marine ecosystems (Haynes & Michalek-Wagner, 2000; Hutchings et al., 2005).
Habitat loss remains a significant threat to many shark populations worldwide (Stevens et al., 2005) and additional degradation and loss of these habitats are expected to increase the vulnerability of shark populations to climate change (Chin, et al., 2010). Furthermore, climate change possibly incite unforeseen human responses that further increase these impacts. While little research has been undertaken to better understand the potential responses of coastal societies (Fenton et al., 2007), rising sea levels and greater variability in weather conditions may lead to the construction of more levees, sea walls dams and weirs, and flood barriers (Chin et al., 2010). While this is hypothetical, these structures have the potential to further disturb the hydrology and connectivity of many coastal habitats, in addition to the timing and volume of freshwater flows. They could also form physical barriers, which in turn may reduce many coastal species’ abilitie to colonize suitable inland areas, leading to the loss of species with increasing sea levels (Waycott et al., 2007). Collectively, these structures may perhaps have significant impacts on many ecological processes, biological connectivity and habitat quality, thus increasing pressure on shark populations.
The collective effects of fishing and habitat degradation are likely to have the most drastic impacts on estuarine, and coastal shark species such as the Bull shark Carcharhinus leucas and the lemon shark Negaprion brevirostris. Freshwater shark species around the world generally face a greater threat due to their restricted distribution, their close proximity to detrimental human activities and the degree of human disturbance to the ecosystems they inhabit (Last, 2002). It has been established that coastal shark species are the most severely exploited group of sharks found on the Great Barrier Reef by commercial fisheries (Chin, et al., 2010). There is much uncertainty in regard to the sustainability of existing harvest levels of these species, especially when combined with the pressures these species face from habitat loss. Considering the effects of these combined factors, it has been proposed that estuarine species could potentially be highly vulnerable to the effects of climate change. Using the example of the Great Barrier Reef, the vulnerability of these species is likely to be observed through changes in the distribution and abundance of these species. Some shark species may become rarer, with the potential to become locally extinct, due to alterations in their distribution in response to the changing conditions of their habitat (Chin, et al., 2010).
The effects that habitat degradation has on shark population dynamics was not considered throughout this research. Species were not categorized dependent on the type of ecosystem they inhabited. There is extensive research showing that the impacts of anthropogenic disturbances on ecosystem health greatly affect the health of shark populations which inhabit them. If this had been considered, then relationships between life history traits and vulnerability may have been observed.
Conclusion
The results of this research into the impacts of life history traits on the susceptibility of shark species to the Anthropocene show that while size of species may be an indicator into the potential vulnerability, other life history traits are not adequate measurements of potential threats.
There are many factors that can impact a species risk of extinction, such as the health of the ecosystem which species inhabit, and the amount of fishing that occurs within its range. To fully understand the threats that species face, these factors must be considered. Merely using life history parameters to gauge species vulnerability is not sufficient. Sharks are vitally important within our marine ecosystems, and it is extremely important that the efforts to conserve these species are extensive and effective.
References
Anderson, S.C., Flemming, J.M., Watson, R. and Lotze, H.K., 2011. Serial exploitation of global sea cucumber fisheries. Fish and Fisheries, 12(3), pp.317-339.
Almany, G.R., 2004. Differential effects of habitat complexity, predators and competitors on abundance of juvenile and adult coral reef fishes. Oecologia, 141(1), pp.105-113.
Arendt, J.D. and Reznick, D.N., 2005. Evolution of juvenile growth rates in female guppies (Poecilia reticulata): predator regime or resource level?. Proceedings of the Royal Society of London B: Biological Sciences, 272(1560), pp.333-337.
Barker, M.J. and Schluessel, V., 2005. Managing global shark fisheries: suggestions for prioritizing management strategies. Aquatic Conservation: Marine and Freshwater Ecosystems, 15(4), pp.325-347.
Baum, J.K., Myers, R.A., Kehler, D.G., Worm, B., Harley, S.J. and Doherty, P.A., 2003. Collapse and conservation of shark populations in the Northwest Atlantic. Science, 299(5605), pp.389-392.
Bellwood, D.R., Hoey, A.S., Ackerman, J.L. and Depczynski, M., 2006. Coral bleaching, reef fish community phase shifts and the resilience of coral reefs. Global Change Biology, 12(9), pp.1587-1594.
Bornatowski, H., Braga, R.R. and Vitule, J.R.S., 2013. Shark mislabeling threatens biodiversity. Science, 340(6135), pp.923-923.
Camhi, M., 1998. Sharks and their relatives: ecology and conservation (No. 20). IUCN.
Cappo, M., Williams, D.M. and Duke, N., 1998. A review and synthesis of Australian fisheries habitat research. Major threats, issues and gaps in knowledge of coastal and marine fisheries habitats: a prospectus of opportunities for the FRDC” Ecosystem Protection Program”.
Carpenter, K.E., Abrar, M., Aeby, G., Aronson, R.B., Banks, S., Bruckner, A., Chiriboga, A., Cortés, J., Delbeek, J.C., DeVantier, L. and Edgar, G.J., 2008. One-third of reef-building corals face elevated extinction risk from climate change and local impacts. Science, 321(5888), pp.560-563.
Carruthers, T.J.B., Dennison, W.C., Longstaff, B.J., Waycott, M., Abal, E.G., McKenzie, L.J. and Long, W.J., 2002. Seagrass habitats of northeast Australia: models of key processes and controls. Bulletin of Marine Science, 71(3), pp.1153-1169.
Chin, A., Kyne, P.M., Walker, T.I. and McAuley, R.O.R.Y., 2010. An integrated risk assessment for climate change: analysing the vulnerability of sharks and rays on Australia’s Great Barrier Reef. Global Change Biology, 16(7), pp.1936-1953.
Clarke, S., Milner-Gulland, E.J. and Bjørndal, T., 2007. Social, economic, and regulatory drivers of the shark fin trade. Marine Resource Economics, 22(3), pp.305-327.
Clarke, S.C., McAllister, M.K., Milner‐Gulland, E.J., Kirkwood, G.P., Michielsens, C.G., Agnew, D.J., Pikitch, E.K., Nakano, H. and Shivji, M.S., 2006. Global estimates of shark catches using trade records from commercial markets. Ecology letters, 9(10), pp.1115-1126.
Collette, B. B., et al. “High value and long life—double jeopardy for tunas and billfishes.” Science 333.6040 (2011): 291-292.
Compagno, L.J., 1990. Alternative life-history styles of cartilaginous fishes in time and space. In Alternative life-history styles of fishes (pp. 33-75). Springer Netherlands.
Cortés, E., 2000. Life history patterns and correlations in sharks. Reviews in Fisheries Science, 8(4), pp.299-344.
Cortes, E., 2002. Incorporating uncertainty into demographic modeling: application to shark populations and their conservation. Conservation biology, 16(4), pp.1048-1062.
Díaz, S., Fargione, J., Chapin III, F.S. and Tilman, D., 2006. Biodiversity loss threatens human well-being. PLoS Biol, 4(8), p.e277.
Dudley, S.F. and Simpfendorfer, C.A., 2006. Population status of 14 shark species caught in the protective gillnets off KwaZulu–Natal beaches, South Africa, 1978–2003. Marine and Freshwater Research, 57(2), pp.225-240.
Duffy, J.E. and Stachowicz, J.J., 2006. Why biodiversity is important to oceanography: potential roles of genetic, species, and trophic diversity in pelagic ecosystem processes. Marine Ecology Progress Series, 311, pp.179-189.
Dulvy, N.K. and Forrest, R.E., 2010. Life histories, population dynamics, and extinction risks in chondrichthyans. In Sharks and their relatives II: biodiversity, adaptive physiology, and conservation (pp. 639-679). CRC Press.
Dulvy, N.K., Fowler, S.L., Musick, J.A., Cavanagh, R.D., Kyne, P.M., Harrison, L.R., Carlson, J.K., Davidson, L.N., Fordham, S.V., Francis, M.P. and Pollock, C.M., 2014. Extinction risk and conservation of the world’s sharks and rays. Elife, 3, p.e00590.
Fenton, M., Kelly, G., Vella, K. and Innes, J., 2007. Climate change and Great Barrier Reef: industries and communities.
Ferretti, F., Worm, B., Britten, G.L., Heithaus, M.R. and Lotze, H.K., 2010. Patterns and ecosystem consequences of shark declines in the ocean. Ecology letters, 13(8), pp.1055-1071.
Forrest, R.E. and Walters, C.J., 2009. Estimating thresholds to optimal harvest rate for long-lived, low-fecundity sharks accounting for selectivity and density dependence in recruitment. Canadian Journal of Fisheries and Aquatic Sciences, 66(12), pp.2062-2080.
Fowler, S.L., Reed, T.M. and Dipper, F., 2002. Elasmobranch Biodiversity, Conservation and Management: Proceedings of the International Seminar and Workshop, Sabah, Malaysia, July 1997 (No. 25). IUCN.
García, V.B., Lucifora, L.O. and Myers, R.A., 2008. The importance of habitat and life history to extinction risk in sharks, skates, rays and chimaeras. Proceedings of the Royal Society of London B: Biological Sciences, 275(1630), pp.83-89.
Gotceitas, V. and Colgan, P., 1989. Predator foraging success and habitat complexity: quantitative test of the threshold hypothesis. Oecologia, 80(2), pp.158-166.
Harley, C.D., Randall Hughes, A., Hultgren, K.M., Miner, B.G., Sorte, C.J., Thornber, C.S., Rodriguez, L.F., Tomanek, L. and Williams, S.L., 2006. The impacts of climate change in coastal marine systems. Ecology letters, 9(2), pp.228-241.
Haynes, D. and Michalek-Wagner, K., 2000. Water quality in the Great Barrier Reef World Heritage Area: past perspectives, current issues and new research directions. Marine Pollution Bulletin, 41(7), pp.428-434.
Heithaus, M.R., Wirsing, A.J. and Dill, L.M., 2012. The ecological importance of intact top-predator populations: a synthesis of 15 years of research in a seagrass ecosystem. Marine and Freshwater Research, 63(11), pp.1039-1050.
Hueter, R.E., Heupel, M.R., Heist, E.J. and Keeney, D.B., 2005. Evidence of philopatry in sharks and implications for the management of shark fisheries. Journal of Northwest Atlantic Fishery Science, 35, pp.239-247.
Heupel, M.R., Carlson, J.K. and Simpfendorfer, C.A., 2007. Shark nursery areas: concepts, definition, characterization and assumptions. Marine Ecology Progress Series, 337, pp.287-297.
Heupel, M.R. and Hueter, R.E., 2002. Importance of prey density in relation to the movement patterns of juvenile blacktip sharks (Carcharhinus limbatus) within a coastal nursery area. Marine and Freshwater Research, 53(2), pp.543-550.
Heupel, M.R., Simpfendorfer, C.A. and Hueter, R.E., 2004. Estimation of shark home ranges using passive monitoring techniques. Environmental Biology of Fishes, 71(2), pp.135-142.
Hutchings, P., Haynes, D., Goudkamp, K. and McCook, L., 2005. Catchment to reef: water quality issues in the Great Barrier Reef Region—an overview of papers. Marine Pollution Bulletin, 51(1), pp.3-8.
Hoffmann, M., Hilton-Taylor, C., Angulo, A., Böhm, M., Brooks, T.M., Butchart, S.H., Carpenter, K.E., Chanson, J., Collen, B., Cox, N.A. and Darwall, W.R., 2010. The impact of conservation on the status of the world’s vertebrates. science, 330(6010), pp.1503-1509.
Hutchings, J.A., 2000. Collapse and recovery of marine fishes. Nature, 406(6798), pp.882-885.
Hutchings, J.A., 2002. Life histories of fish. Handbook of Fish Biology and Fisheries, Volume 1: Fish Biology, pp.149-174.
Iglésias, S.P., Toulhoat, L. and Sellos, D.Y., 2010. Taxonomic confusion and market mislabelling of threatened skates: important consequences for their conservation status. Aquatic Conservation: Marine and Freshwater Ecosystems, 20(3), pp.319-333.
IUCN., 2010. Guidelines for Using the IUCN Red List Categories and Criteria
Jackson, J.B., 2010. The future of the oceans past. Philosophical Transactions of the Royal Society of London B: Biological Sciences, 365(1558), pp.3765-3778.
Kriwet, J., Witzmann, F., Klug, S. and Heidtke, U.H., 2008. First direct evidence of a vertebrate three-level trophic chain in the fossil record. Proceedings of the Royal Society of London B: Biological Sciences, 275(1631), pp.181-186.
Lack, M. and Sant, G., 2009. Trends in global shark catch and recent developments in management. TRAFFIC International, 33.
Fowler, S.L., Reed, T.M. and Dipper, F., 2002. Elasmobranch Biodiversity, Conservation and Management: Proceedings of the International Seminar and Workshop, Sabah, Malaysia, July 1997 (No. 25). IUCN.
Lotze, H.K., Lenihan, H.S., Bourque, B.J., Bradbury, R.H., Cooke, R.G., Kay, M.C., Kidwell, S.M., Kirby, M.X., Peterson, C.H. and Jackson, J.B., 2006. Depletion, degradation, and recovery potential of estuaries and coastal seas. Science, 312(5781), pp.1806-1809.
Mace, G., Masundire, H., Baillie, J., Ricketts, T., Brooks, T. 2005. Biodiversity. Ecosystems and human well-being: current state and trends: findings of the condition and trends working group, Island Press, Washington DC, 77-122.
MacArthur, R.H. and Wilson, E.O., 1963. An equilibrium theory of island biogeography.-Evo-lution 17: 373-387., and. 1967. The theory of island biogeography. Monographs in Population Biology, 1, pp.1-203.
McClenachan, L., Cooper, A.B., Carpenter, K.E. and Dulvy, N.K., 2012. Extinction risk and bottlenecks in the conservation of charismatic marine species. Conservation Letters, 5(1), pp.73-80.
Munday, P.L., 2004. Habitat loss, resource specialization, and extinction on coral reefs. Global Change Biology, 10(10), pp.1642-1647.
Munday PL, Jones GP, Pratchett MS, Williams AJ (2008) Climate change and the future for coral reef fishes. Fish and Fisheries, 9, 261–285
Musick, J.A. ed., 1999. Life in the Slow Lane: Ecology and Conservation of Long-Lived Marine Animals. American Fisheries Society Symposium 23 (p. 265pp). American Fisheries Society, Bethesda, Maryland, USA.
Musick, J.A. and Musick, S., 2011. Sharks (Special Topics C3), in review of the state of the world Marine fishery resources. Food and Agriculture organization of the United nations, Rome, Italy, 569, pp.245-254.
Myers, R.A., Baum, J.K., Shepherd, T.D., Powers, S.P. and Peterson, C.H., 2007. Cascading effects of the loss of apex predatory sharks from a coastal ocean. Science, 315(5820), pp.1846-1850.
Nagelkerken, I.S.J.M., Blaber, S.J.M., Bouillon, S., Green, P., Haywood, M., Kirton, L.G., Meynecke, J.O., Pawlik, J., Penrose, H.M., Sasekumar, A. and Somerfield, P.J., 2008. The habitat function of mangroves for terrestrial and marine fauna: a review. Aquatic botany, 89(2), pp.155-185.
Neubauer, P., Jensen, O.P., Hutchings, J.A. and Baum, J.K., 2013. Resilience and recovery of overexploited marine populations. Science, 340(6130), pp.347-349.
Newton, K., Cote, I.M., Pilling, G.M., Jennings, S. and Dulvy, N.K., 2007. Current and future sustainability of island coral reef fisheries. Current Biology, 17(7), pp.655-658.
Polidoro, B.A., Livingstone, S.R., Carpenter, K.E., Hutchinson, B., Mast, R.B., Pilcher, N.J., de Mitcheson, Y.S. and Valenti, S.V., 2009. Status of the world’s marine species. Wildlife in a Changing World–An Analysis of the 2008 IUCN Red List of Threatened Species, p.55.
Polidoro, B.A., Brooks, T., Carpenter, K.E., Edgar, G.J., Henderson, S., Sanciangco, J. and Robertson, D.R., 2012. Patterns of extinction risk and threat for marine vertebrates and habitat-forming species in the Tropical Eastern Pacific. Marine Ecology Progress Series, 448, pp.93-104.
Poulard, J.C. and Blanchard, F., 2005. The impact of climate change on the fish community structure of the eastern continental shelf of the Bay of Biscay. ICES Journal of Marine Science: Journal du Conseil, 62(7), pp.1436-1443.
Ricard, D., Minto, C., Jensen, O.P. and Baum, J.K., 2012. Examining the knowledge base and status of commercially exploited marine species with the RAM Legacy Stock Assessment Database. Fish and Fisheries, 13(4), pp.380-398.
Schipper, J., Chanson, J.S., Chiozza, F., Cox, N.A., Hoffmann, M., Katariya, V., Lamoreux, J., Rodrigues, A.S., Stuart, S.N., Temple, H.J. and Baillie, J., 2008. The status of the world’s land and marine mammals: diversity, threat, and knowledge. Science, 322(5899), pp.225-230.
de Séligny, J.F.P. and Grainger, R., 2010. The State of World Fisheries and Aquaculture 2010.
Simpfendorfer, C.A., Hueter, R.E., Bergman, U. and Connett, S.M., 2002. Results of a fishery-independent survey for pelagic sharks in the western North Atlantic, 1977–1994. Fisheries Research, 55(1), pp.175-192.
Sinclair, A.R.E., Mduma, S. and Brashares, J.S., 2003. Patterns of predation in a diverse predator–prey system. Nature, 425(6955), pp.288-290.
Stevens, J.D., Bonfil, R., Dulvy, N.K. and Walker, P.A., 2000. The effects of fishing on sharks, rays, and chimaeras (chondrichthyans), and the implications for marine ecosystems. ICES Journal of Marine Science: Journal du Conseil, 57(3), pp.476-494.
Stevens, J.D., Walker, T.I., Cook, S.F. and Fordham, S.V., 2005. Threats faced by chondrichthyan fish.
Stevens, J.D., Bonfil, R., Dulvy, N.K. and Walker, P.A., 2000. The effects of fishing on sharks, rays, and chimaeras (chondrichthyans), and the implications for marine ecosystems. ICES Journal of Marine Science: Journal du Conseil, 57(3), pp.476-494.
Waycott, M., Collier, C., McMahon, K., Ralph, P., McKenzie, L., Udy, J. and Grech, A., 2007. Vulnerability of seagrasses in the Great Barrier Reef to climate change. Great Barrier Reef Marine Park Authority and Australian Greenhouse Office.
Worm, B., Davis, B., Kettemer, L., Ward-Paige, C.A., Chapman, D., Heithaus, M.R., Kessel, S.T. and Gruber, S.H., 2013. Global catches, exploitation rates, and rebuilding options for sharks. Marine Policy, 40, pp.194-204.
Worm, B., Hilborn, R., Baum, J.K., Branch, T.A., Collie, J.S., Costello, C., Fogarty, M.J., Fulton, E.A., Hutchings, J.A., Jennings, S. and Jensen, O.P., 2009. Rebuilding global fisheries. science, 325(5940), pp.578-585.
Sadovy, Y., 2005. Trouble on the reef: the imperative for managing vulnerable and valuable fisheries. Fish and Fisheries, 6(3), pp.167-185.
Cite This Work
To export a reference to this article please select a referencing stye below:
Related Services
View all


Related Content
All TagsContent relating to: "Animal Sciences"
Animal science can be described as studying the biochemistry, physiology, and behaviour of animals that are under human control. Historically, animal science degrees were known as animal husbandry and focused on livestock. Studies now include companion animals such as cats and dogs.
Related Articles

DMCA / Removal Request
If you are the original writer of this dissertation and no longer wish to have your work published on the UKDiss.com website then please: