Knowledge, Attitudes and Understanding of Low-fat Nutrition Labels/Claims among University Students
Info: 21846 words (87 pages) Dissertation
Published: 16th Dec 2019
Tagged: HealthFood and Nutrition
Evaluating the Knowledge, Attitudes and Understanding of Low-fat Nutrition Labels/Claims among University Students
Abstract
Background: Studies have shown that Traffic Light (TL) nutrition labels can be effective in directing consumers towards healthier food choices. While the self-reported understanding of labels is relatively high (>50%), it is not reflective of its actual use. The study assessed the knowledge, attitudes, self-reported and practical understanding of TL labels and low-fat claims on food products; among university students due to the limited literature available on this demographic.
Methodology: The cross-sectional study, included a questionnaire comprising of 11 forced-choice and free-response questions (n=111) and a sensory experiment (n=43) to investigate if the taste of low-fat products affects consumer preference. Chi-square analysis, independent t-tests and statistical tables were used during data analysis.
Results: Of the 97.3% respondents who were aware of TL labels, 93.7% agreed that it can support consumers in making healthier food choices and aid in the reduction of diet-related diseases (p=0.026). While the self-reported rate for label use was 76.9%, (Females: 50%; Males: 26.9%) only 41.4% were able to interpret the TL labels correctly. Similarly, 51.3% of the participants perceived that low-fat foods did not have fewer calories; with 18.9% stating that it was due to the sugar-fat replacement. Findings from the sensory experiment indicated that the presence of nutrition information does not alter consumers’ preference for food products.
Conclusion: Low levels of practical understanding on TL labels indicated that consumers may not effectively use the labels, especially when a low-fat claim is made; masking the overall credibility of the nutrition information provided to facilitate a healthy dietary choice.
- Introduction
The shift in dietary patterns since the 1980s is one of the biggest influencers of the rising rates in overweight and obesity due to increased calorie consumption worldwide (WHO 2015). The prevalence of overweight and obesity has doubled since the 1980s globally (Swinburn et al., 2011; Ng et al., 2014; PHE, 2016); with 1.9 billion (39%) adults aged 18 and above being overweight, and 600 million (13%) classed as obese in 2014 (WHO, 2015). The increased availability of ultra-processed foods which are formulated with the addition of additives and preservatives apart from salt, sugar, fats and oils to imitate the organoleptic properties of a minimally processed food product (Martínez-Steele et al., 2016) has led to the increased consumption rate; accounting for more than 50% of the total calorie intake in high-income countries (Monteiro et al., 2013). The United Kingdom (UK) is ranked eighth among 34 Organisation for Economic Cooperation Development (OECD) countries for its overweight and obesity prevalence (OECD, 2016).
Although the prevalence trend is lower than in the US, the rate of growth is 72% higher in the UK compared to a 46% increase in the US, since the 1980s. This is potentially due to the growth in affluence as a nation and the increased employment specifically among women; who work outside of home, which in turn negatively influences the time spent for home activities, such as food preparation (Johnson, 2012). Also, the wide availability of energy dense and convenience foods (Johnson et al., 2015; Atay & Bereket; 2016), promotes excessive caloric intake (Musingarimi, 2008) contributing to a significant clinical and economic burden to the nation. If the current trends continue to persist, 3.3 billion (57.8%) of the global adult population will be overweight or obese (Kelly et al., 2008) while an additional 11 million adults in the UK will become obese by 2030 (Wang et al., 2011). With respect to the economic burden, it was estimated that the National Health Service (NHS) in England spent £5.1 billion in 2014/2015 on overweight and obesity-related ill health treatments (Scarborough et al., 2011; PHE; 2016) and if the present trends continue, it would cost the NHS approximately, £22.9 billion a year by 2050 to treat obesity and its co-morbidities in the UK (Johnson et al., 2015).
1.1 Nutrition Labelling as an Intervention Tool
Based on the data collected by the National Diet Nutrition Survey (NDNS) in 2012, the average diet of a British adult exceeds the recommended dietary intakes of non-milk extrinsic sugars, salt and fats (NOO, 2012). This is of great concern due to the linear relationship between the increased consumption of convenience foods and the risks of non-communicable diseases (NCDs) such as cardiovascular disease (CVD), diabetes and obesity (Jones & Richardson, 2007). With obesity and its co-morbidities being a multi-faceted issue, governments and other regulatory bodies are developing a range of policy interventions to tackle the epidemic. Some of which include, public health messages to reduce the intake of limiting nutrients (WHO, 2002) as well as the display of nutrition labels on pre-packaged food products to promote healthy eating habits among the population (Cowburn & Stockly, 2005).
Nutrition labelling is a cost-effective strategy (Cecchini et al., 2011) that facilitates the consumer to make informed dietary choices. It is seen as a credible source of information and an education tool that can help influence consumer behaviour at the point of purchase (Kyle & Thomas, 2014). Although nutrition labelling on pre-packaged food products used to be voluntary in the European region (Campos et al., 2011), and is only mandated if a nutrition claim has been made on the product (Grunet & Wills, 2007); the guideline was modified as of December 2016. All pre-packaged products (excluding exempted products such as teas, flavourings, additives and etc.) require nutrition information to be displayed on the back or the side of the packaging (PHE, 2017), similar to the labelling regulations in the United States and Canada (Campos et al., 2011).
Nutrition information shown on the back-of-pack (BoP), typically contains information on the serving size, energy, protein, fat, saturated fat, carbohydrate, added sugars, fibre, salt, vitamins and minerals (Borgmeier & Westenhoefer, 2009). While its purpose is to aid consumers in the purchase decision of the product, research has shown that BoP labels can be confusing due to the numbers and terminologies used (Cowburn & Stockley, 2005); and easily misinterpreted while estimating the nutritional value of the product based on the portion size to be consumed (Drichoutis et al., 2006; Heike & Taylor, 2012; Miller & Cassady, 2015). Due to the reported difficulties in interpreting the quantitative information on the BoP labels (Baltas, 2001; Drichoutis et al., 2006; Campos et al., 2011), the efficacy of nutrition labels influencing consumer purchase behaviours was compromised. As a result, a simple, systematic and clearer format like a graphic representation (Campos et al., 2011) that allows a quick assessment of the product was required, to communicate the same information to the consumers (Lynam et al., 2011).
Hence, simplified nutrition labels were developed by the respective regulatory bodies, food manufacturers, retailers and not-for-profit organisations to supplement the existing BoP information, on food products (Feunekes et al., 2007; Borgmeier & Westenhoefer, 2009; Tarabella & Voinea, 2013). The front-of-pack (FoP) labels can be added to pre-packaged food products on a voluntary basis in the European region, to further support consumers with the decision-making process. A FoP label provides a summarised version of nutrition information found on the BoP by interpreting the levels of energy and the key limiting nutrients such as fat, saturated fat, sugars and salt (Feunekes et al., 2007; Talati et al., 2016); providing the consumer with concise details on the overall healthiness of the product (Feunekes et al., 2007).
As FoP labels require a lower amount of time and cognitive effort to process the nutrition information provided on a food product; it can better guide consumers with the food purchase decisions (Feunekes et al., 2007) especially since there has been evidence on the limited opportunities consumers have in a supermarket environment to process detailed BoP labels and instead, glance at the nutrition information at the point of purchase (Higginson et al., 2002).
- Front-of-Pack (FoP) Nutrition Label Formats
Various types of FoP labelling systems provide either summary-based or nutrient specific information (Wartella et al., 2010) in the form of simplistic health logos or detailed labels highlighting the key nutrients of the food product.
- Health Logo/Symbol
Interpretive logos placed on the front of a food product can enable the quick and easy identification of foods based on its overall nutritive value (Feunekes et al., 2007; Wartella et al., 2010), reducing the level of cognitive skills required to analyse the information (Grunert et al., 2010). The health logos are applied to food products that meet specific nutrient requirements based on the product categories. Some examples of the health logos include the American Heart Association Heart Check which is applied to heart-healthy products, USA’s Smart Spot, Singapore’s Healthier Choice Symbol, Australia/NZ’s “Pick the Tick” symbol, Swedish Food Administration Keyhole and the Choices logo that are seen on foods that meet the respective nutrient requirements for selective nutrients such as trans-fat, saturated fat, fat, salt, sugars and fibre (Young & Swinburn., 2002; Wartella et al., 2010; Roodenburg et al., 2011; HPB, 2017; Choices, n.d.)
- Guideline Daily Amounts (GDA) Labelling System
The guideline daily amounts (GDA) labelling system is one of two types of detailed FOP systems voluntarily adopted in the European region. Developed by the Institute of Grocery Distribution (IGD) in the UK, the GDA labels act as a guide for consumers showing the amount of energy and nutrients present in a portion size of a food product, as a percentage, based on the recommended energy requirement for a healthy adult of 2000 kilocalories a day (Borgmeier & Westenhoefer, 2009; Tarabella & Voinea, 2013).
The aim of GDA labels is to provide nutrition information in a clear and an objective manner to allow the consumer to make an informed food choice. Although, the GDA system has received considerable attention on its user-friendliness and the increased level of consumer understanding of reading such labels in the UK and Sweden (Grunert et al., 2010), it has been reported that the GDA system may not be appropriate for all consumers; specifically those with low levels of education. As the system uses a quantitative approach in displaying the nutrition information, it requires consumers to scrutinise the information carefully. Also, as the portion sizes are determined by the manufacturers, the nutritional profile of the product can be adjusted with a smaller portion size, especially for high caloric foods such as crisps and chocolates, altering the consumer’s choice (Tarabella & Voinea, 2013).
- Traffic Light (TL) Labelling System
Developed by the Food Standards Agency (FSA) in 2006, the Traffic Light (TL) labelling system uses the red, amber and green colour codes to indicate the high, moderate and low amounts of limiting nutrients per portion based on the recommended daily energy intake of a healthy adult (Borgmeier & Westenhoefer, 2009). Apart from influencing healthier food choices, the purpose of the TL system is to help consumers overcome the challenges faced with previous labelling systems (Malam et al., 2009). With its clear and simple approach to influence the consumer’s purchase behaviours, the above system has been recognised and supported by health organisations for its effectiveness and its wide reach to the various target groups, regardless of educational level, age, and sex (Sacks et al., 2009). Furthermore, it is a potential tool to help shape the eating habits of young children and adolescents (Tarabella & Voinea, 2013). Based on the UK FSA and a market study conducted by the European Food Information Council (EUFIC), it was revealed that the TL labelling format was well understood and widely accepted by the population (EUFIC, 2008; Borgmeier & Westenhoefer, 2009).
On the flipside however, TL labels can hinder with the comparison of two similar food products as the labelling system does not have a benchmark criteria on the recommended products and only targets the limiting nutrients; neglecting the presence of other nutrients; such as dietary fibre and protein. Moreover, for dairy products, nutrients such as saturated fat are highlighted in red. This compromises the presence of other positive nutrients such as calcium (Wartella et al., 2010; Tarabella & Voinea, 2013). Apart from that, the representation of the red colour in TL labels led 73% of the UK consumers to believe that the product needs to be avoided, rather than being consumed on occasion (EUFIC, 2008).
- Health and Nutrient Claims
Health claims are defined as the written description of scientifically proven health benefits associated with the consumption of a certain food product (i.e. calcium may help improve bone density) (Williams, 2005); while, nutrient claims informs the consumer about the presence or absence of a nutrient (i.e. low in fat/sugars) (Talati et al., 2016). Such claims are added onto the FoPs, to serve the same role as the above mentioned labelling systems- to guide consumers in making better informed food choices (Hung et al., 2017), while also instilling a competitive edge for a product in the food industry.
While health claims are a beneficial tool that provides essential information cues influencing food choice (Heike et al., 2015; Talati et al., 2016), it can mislead consumers due to the positive representation of a product instead of displaying the overall summary of its nutritional value. For instance, a product with a low-fat or a fat-free claim is compensated with considerable quantities of other unhealthy nutrients such as sugar (Talati et al., 2016) to maintain the sensory properties of the original version (Sandrou & Arvanitoyannis, 2000). The lack of clarity on these claims can affect unbiased product evaluations, influencing the consumption of the products in larger quantities as compared to a product without the claim (Faulkner et al., 2014); or lead to a favourable judgement (Saba et al.,2010). Although the claims are intended to support informed decisions towards healthy food choices, a qualitative study conducted in Australia reported that the consumers saw the presence of health and nutrient claims as a marketing gimmick, due to the lack of trust in the food manufacturers (Talati et al., 2016).
- Consumer Knowledge, Understanding and Use of FoP Labels
The availability and affordability of convenience foods that are high in fat, sugar and salt can be attributed to the poor food purchasing and consumption habits among the younger population group (Plotnikoff et al., 2015), particularly in university students, who are living away from home for the first time (Graham & Laska, 2012). The poor dietary choices adopted during this period are likely to continue throughout their lives (Plotnikoff et al., 2015; Aceijas et al., 2016). Therefore, it is important to facilitate healthy dietary choices through the provision of nutrition information on pre-packaged foods.
The UK has taken the lead in promoting healthier food choices through FOP labels (Grunert et al., 2010) compared to its European counterparts, with 82% of the food products displaying the FoP labels (Draper et al., 2011). With a variety of FoP labelling systems being adopted by the food industry, studies have been conducted to investigate if the presence of FoP labels has indeed influenced consumers’ dietary choices.
- Knowledge, Understanding and Use of FoP labels in the General Population
Based on a systematic review and meta-analysis conducted by Cecchini and Warin (2016), it was noted that the traffic light labelling format can be significantly effective in influencing consumers to make healthier food choices. This was also observed in several other studies conducted in the European region, evaluating the use and understanding of nutrition labels among consumers. The display of nutrition labels has received widespread attention (Grunert & Wills; 2007) among consumers, particularly due to the increased interest in health and diet issues (Borgmeier & Westenhoefer, 2009). Of the six different label formats evaluated; including a healthier choice tick, health protection factor, stars, smileys, multiple traffic light system and the wheel of health, the TL system scored the highest among other formats due to its credibility and understanding (Feunekes et al., 2007). Although there was a high awareness rate (81%) of TL labels among UK consumers (EUFIC, 2008), the understanding level was slightly lower, ranging from 58% to 71% (Malam et al., 2009).
- Self-reported and Actual Use of FoP Labels
Although the understanding of nutrition information is relatively high in the UK, the level of understanding does not equate to the usage level. Often the self-reported rates of label use is generally high (Cowburn & Stockley, 2015) and above 50% (Campos et al., 2011). However, consumers reportedly had difficulties interpreting the quantitative information found on the labels (Baltas, 2001; Mhurchu & Gorton, 2007). Moreover, several other studies conducted by EUFIC (2008), revealed that only 25% of the UK consumers look for nutrition information in a supermarket environment (Tarabella & Voinea, 2013) and analyse the nutrition label of a food product for about 25 seconds (EUFIC, 2008); focusing on calorie, fat, saturated fat, sugar and salt content (Grunert et al., 2010).
Prevalence of label use in relation to demographic factors changes with age, gender, education and income level, irrespective of the label formats. For instance, in the United States, older participants referred to nutrition labels as source of information, as opposed to the younger population due to the increased interest, in health and diet issues (Worsley, 2003; Borgmeier & Westenhoefer, 2009). Similarly, Females had a higher tendency to refer to nutrition labels than males (Misra, 2007; Campos et al., 2011) influencing their dietary choice. Similarly, this was also observed in studies involving university students. The knowledge, attitudes and understanding about diet-disease relationship was significantly higher in females than males at a 99% confidence level (Rasberry et al., 2007; Cooke & Papadaki, 2014). A linear relationship with regards to the level of education was also reported in the literature (Worsley, 2003; Satia et al., 2005; Hess et al., 2005; Campos et al., 2011).
- Motives of FoP Label Use among Consumers
Apart from understanding the nutrition information displayed on the food product, the level of motivation to make use of the label is essential to help steer consumers towards healthier food choices (Grunert et al. 2010). Studies have identified a range of contributing factors for increased label use among consumers. Grocery shopping habits is the most common influencer for label use. However, this is highly reliant on the time spent reviewing the product (Jordan Lin et al., 2004) Furthermore, the use of labels can be positively influenced with nutrition education, weight control, knowledge of the diet-disease relationship and diagnosis of disease (Rasberry et al., 2007; Smith et al., 2007; Campos et al., 2011). Similarly, consumers who are concerned with the dietary recommendations and nutritional quality of food had reported a higher usage of nutrition labels (Krystallis & Ness, 2004). However, the sensory properties of the food product was noted as an important attribute in the decision making process and can override the analysis of the labels before the point of purchase, in some studies (Jensen et al., 1996; Nagya et al., 1998; Nagya, 2000; Grunert & Wills, 2007; Borgmeier & Westenhoefer, 2009). This was further supported in the research conducted by Godwin et al. (2006) with half of the 160 samples consuming high-calorific products such as crisps, chocolates, pastries and soda without looking at the nutrition labels displayed on the product. While, two other research studies indicated that there was no association between the consumption of hedonic foods and the analysis of nutrition labels (Guthrie et al., 1995; Drichoutis et al., 2005).
- Impact of Low-fat Nutrient Labels/Claims on Consumer Perception
According to an online survey conducted at Ulster University, students perceived that the key to being healthy, involved limiting the intakes of total fat, saturated fat and sugar (Tierney et al., 2017). While the display of the TL labels are helpful in the evaluation of a food product for 81% of the participants, the purpose of a nutrient claim is to communicate the relative amount of a specific nutrient in a product. It is also often used as a marketing technique to promote the product over its counterparts (Williams 2005; Miller & Cassady, 2015). The use of health claims to evaluate the healthiness of the product has been under constant scrutiny, due to the likelihood of consumers being misled (Hasler, 2008) to perceive a product to have a better nutritional value than the other; when the product with a claim can potentially be more energy dense than one without the message (Fontaine et al., 2004; Balasubramanian & Cole, 2002). Nutrient claims and labels are platforms that convey the objective and subjective consumption cues to individuals. While objective cues can be information related to the serving size, subjective cues are the presence of nutrient claims and the absence of information on the portion size (Wansink & Chandon, 2006).
In the context of products with low-fat labels, the original intention for its endorsement was to guide consumers towards portion control (Wansink & Huckabee, 2005). On the other hand, the claim can induce a “halo effect” that could influence the consumer to believe that the product is healthy, based on a single-nutrient claim (Hughes et al., 2013; Cecchini & Warin, 2016). Such a perception can drive a consumer towards the overconsumption of an energy dense product (Hedley et al., 2004). The display of a low-fat claim can convince an individual to overindulge on hedonic food products such as chocolates and savoury snacks in the absence of an energy deficit, due to the perceived, lower level of guilt associated with the claim. Furthermore, a one-time binge can contribute to rapid satiation and increase the likelihood of weight gain as a result (Wansink & Chandon, 2006).
This is of great concern, specifically in the younger demographic who are pursuing their tertiary education as previous studies have indicated that substantial weight gain occurs during this phase (Gropper et al., 2012; Fedewa et al., 2014); due to the increased intakes of food that is high in sugar, fats and salt. Moreover, the accessibility and affordability of such foods can have a negative influence on the food purchasing techniques within this target group, (Plotnikoff et al., 2015). Hence, it is vital to guide this population group towards healthier dietary choices, by facilitating informed decision making through the presentation of nutrition information as it is likely to follow through adulthood (Plotnikoff et al., 2015). While, there is a wide availability of literature on the knowledge, attitudes, understanding and use of nutrition labels among the general population and college students, based in the United States and Australia; there is limited literature available on UK university students with respect to this research area. This study will assess the knowledge, attitudes and self-reported understanding of nutrition labels as seen in similar studies; indicating that females had a higher level of nutritional knowledge and made use of nutrition labels more frequently than males (Huang et al., 2004; Misra, 2007; Cooke & Papadaki, 2014; Tierney et al, 2017). In addition, the study will also investigate the actual level of label understanding particularly in relation to low-fat nutrition labels and claims and evaluate if the taste profile of low-fat food products can influence consumer preference.
- Aims & Objectives
2.1 Aim
To evaluate the consumer knowledge, attitudes and understanding towards nutrition labels and claims
- Objectives
- To assess the knowledge and understanding of front-of-pack nutrition labels among university students
- To investigate consumer attitudes towards low-fat nutrition claims and its impact on food choice among university students
- To examine the relationship between the taste profile of low-fat food products and how the presence of nutrition information can influence consumer choice
- Methodology
3.1 Study Design
The study assessed the level of knowledge, attitudes and understanding of low-fat nutrition labels among a sample population of UK university students within Liverpool. A cross-sectional design was used for this study, as similar studies had also utilised this approach to evaluate the level of knowledge, attitudes and understanding of nutrition labels in a specific population (Barker et al., 2003; Rasberry et al., 2007; Hung et al., 2017). The current study comprised of two quantitative components which included a questionnaire (Appendix 1) and a three-part sensory evaluation (Appendix 2; Appendix 3) using regular-fat and low-fat hummus samples, to determine the relationship between variables within the demographic group (Flick, 2015). Data collection for questionnaires was conducted over a one-month period while the sensory experiment was conducted over a two-week period between January and February 2017.
3.1.1 Participants
As the study protocol did not have any ethical conflicts (Appendix 4), it was approved following a preliminary review with no further submission made to the research ethics panel to conduct this research. Participants for both experimental components were recruited at random to prevent research bias (Reis & Judd, 2000), even though the target demographic was pre-determined for this study. Participant recruitment was advertised to students across all faculties in Liverpool John Moores University (LJMU) and University of Liverpool (UoL) using a range of platforms. Interested students (n=111) aged 18 and above, were recruited to complete the questionnaire anonymously, in person (n=31) at LJMU campuses (Avril Robarts and IM Marsh); or online (n=80) using the Bristol Online Survey (BOS) portal- a web-based survey tool used to administer questionnaires such as the above to achieve the outcomes of the research. A link to the online version of the questionnaire was advertised with a synopsis explaining the purpose of the research on the following Facebook pages: LJMU International society, African-Caribbean society and the researcher’s personal Facebook page, which was then subsequently shared and forwarded to individuals through the word of mouth within the target demographic pursuing tertiary education in LJMU or UoL. In addition, a recruitment email (Appendix 5.1) via the university’s electronic mailing system was circulated to students from the school of sports studies, leisure and nutrition which included students from sports sciences and food science and nutrition within LJMU.
Convenience random sampling was also used for the three-part sensory experiment. Participants (n=43) studying at LJMU were chosen based on their availability and willingness to take part in the research. Participants were recruited at LJMU’s IM Marsh campus via the word of mouth of university lecturers, the researcher and through the circulation of a recruitment advertisement (Appendix 5.2) via the university email to sports science and food and nutrition students. Prior to the start of the evaluation, participants were screened for any potential nut allergies. This was ensured through the reading of the participant information sheet (Appendix 6) and the receipt of the signed consent forms (Appendix 7) which was adopted in a similar study conducted by Rasberry et al., 2007, indicating the participants’ approval to take part in the experiment. To maintain anonymity of the participants, the consent forms were separated from the sensory questionnaire. Although 43 participants had taken part in all three parts of the sensory evaluation, only the data of 37 participants were selected for the last stage of the sensory experiment, due to an unexpected experimental discrepancy that nullified the responses of six participants.
3.1.2 Questionnaire
A self-administered questionnaire (Appendix 1) which took about ten minutes to complete was disseminated online and in person to obtain data on the demographic group, the level of knowledge, attitudes, subjective and objective understanding of nutrition labels. The questionnaire design was based on a previously validated questionnaire that looked into the nutrition knowledge in an adult population (Parmenter & Wardle, 1999). A total of 11 forced choice (multiple-choice) and free response questions were included in the questionnaire. The structure of the questions began with demographic characteristics of the participants such as sex, age, education level and the programme of study. This was followed by questions that assessed the knowledge and awareness of Traffic Light (TL) labels; and its relationship to diet and disease. Subjective and objective understanding of TL labels was evaluated using the comparison of nutrition labels of food products from the same product category. While, scenario-based questions were used to determine the preference and attitudes towards food products low-fat nutrition claims among participants.
3.1.3 Sensory Evaluation
The three-part sensory evaluation procedure was conducted at the LJMU Food Academy, located at the IM Marsh campus in Aigburth, Liverpool. All tests were conducted in individual, partitioned booths with white lighting. The evaluation, which required comparative judgements, used a simultaneous sample design (Kemp et al., 2009), which involved participants to evaluate two store-bought hummus samples that varied significantly in fat content based on its taste.
3.1.3.1 Triangle Test
The triangle test was the first of three tests that was conducted, to determine if participants were able to identify the difference between the regular and low fat samples. Six possible sample combinations (ABB, BAA, AAB, BBA, ABA, BAB) were prepared (Kemp et al., 2009; Meilgaard et al., 2016) and randomly presented to the participants in separate plastic cups, labelled with a random three-digit code to avoid bias and inaccuracies (Kemp et al., 2009; Moskowitz et al., 2012) (Appendix 2.2).
The participants were presented with three hummus samples, two of which were of the same fat content. Participants were briefed on the test procedure as they were untrained. Hence, they were told to taste the products in order, from left to right (Meilgaard et al., 2016); drinking water in between each sample to cleanse the palate as observed in the British Standards (1986) for sensory analysis throughout the evaluation procedure. After which, the participants recorded their responses on a score sheet that was provided together with the samples (Appendix 3.1).
3.1.3.2 Paired Preference Test
Following the triangle test, participants were briefed on the second part of the evaluation which required them to select a hummus sample they preferred based on its taste profile. The purpose of the test was to determine if any significant sensory difference existed (Lyon et al. 2012) between the regular and low-fat hummus samples. The samples were blind coded using randomised three-digit numbers and served in two possible combinations (AB, BA) to the participants (Appendix 2.3). Upon tasting both samples, participants were reminded to record their preference on the score sheet provided (Appendix 3.2).
3.1.3.3 Paired Comparison Test
As the final leg of the sensory analysis had the same objective as in the paired preference test, the test procedure remained the same. Participants received the samples they were presented with previously in the same order (Appendix 2.4), to identify the sample they perceived to be lower in fat, based on the analysis of the nutrition information provided; and selected the preferred sample upon assessing the nutrition label. 12 of the 37 participants were given two of the same samples (AA/BB) but were not made aware of the change. This was done to evaluate if the presence of the nutrition label had influenced a different preference as opposed to the former test which was then recorded on a score sheet (Appendix 3.3).
- Data Analysis
- Calculations
Manual calculations were done for all three parts of the sensory evaluation. For the triangle test, the number of participants who identified the odd sample correctly were counted and compared to the statistical table (Appendix 8), to determine if a difference was present at 5% significance level. Similarly, the greater number of responses was compared against the statistical table (Appendix 9) at the set significance level (α=0.05) for the data obtained through the paired preference and comparison tests to assess if there was difference between the tested hummus samples.
3.2.2 Statistical Analysis
The Statistical Package for the Social Sciences Software (IBM SPSS Statistics Version 23) was used to analyse the data collected through the questionnaires. Responses to the open-ended questions were grouped, coded and quantified for the ease of analysis (Flick, 2015; Tierney et al., 2017). Basic descriptive statistics including means and frequencies were used to analyse the demographic data (Rasberry et al., 2007; Vyth et al., 2010). This was also used alongside chi-squaretests and cross tabulations to determine the relationship between the demographic data and the knowledge, attitudes and understanding of nutrition labels. Based on similar researches conducted in the past, an independent t-test was used to compare the actual understanding of nutrition labels and gender (Marietta et al., 1999; Rasberry et al., 2007). The level of significance was set at 5% for all statistical tests.
- Results
4.1 Demographic Characteristics
| Sample Characteristics | No. of Samples (n) | Percentage (%) |
| Sex:
Male Female |
38
73 |
34.2
65.8 |
| Age Group:
18-21 22-25 26-29 ≥30 |
75
20 10 6 |
67.6
18.0 9.0 5.4 |
Table 1: General Characteristics of Participants (n=111)
| Education | ||||
| Programme of Study | Undergraduate | Postgraduate | ||
| No. of Samples (n) | Percentage (%) | No. of Samples (n) | Percentage (%) | |
| Business
IT & Engineering Biological & Life Sciences Education Food Science & Nutrition Law Fine Arts & Media Medicine & Allied Health Sports Sciences |
11
6 13 4 18 2 12 6 27 |
11.1
6.1 13.1 4.0 18.2 2.0 12.1 6.1 27.3 |
3
2 1 0 0 0 1 5 0 |
25
16.7 8.3 0 0 0 8.3 41.7 0 |
| Total | 99 (89.2%) | 12 (10.8%) | ||
Table 2: Participant Distribution based on Course Programmes (n=111)
Of the 111 participants who completed the questionnaire, 65.8% of the participants were females, while majority of the sample (67.6%) was between 18 and 21 years of age as seen above in Table 1. Recruited participants were either pursuing their undergraduate (89.2%) or postgraduate (10.8%) degrees from a range of programmes as presented in Table 2 in Liverpool John Moores University (LJMU) or University of Liverpool (UoL).
4.2 Knowledge, Attitudes and Understanding of Nutrition Labels
| Demographic Characteristics* | Relationship between Nutrition Labels & Disease2,4 | Awareness of TL Labels3 | Self-reported Label Use | Purchase Behaviour | |||||||||
| Percentage (%) | |||||||||||||
| Yes | No | Aware | F1 | O1 | R1 | N1 | Yes, If it is similarly priced | Yes, even if it is more expensive | No, due to the price range | Not Interested | |||
| Sex2:
Male Female |
32.4
61.3 |
1.8
6.3 |
33.3
64 |
16.7
32.4 |
10.2
17.6 |
4.6
9.3 |
2.8
6.5 |
21.6
36.0 |
7.2
5.4 |
0.9
7.2 |
4.5
17.1 |
||
| Total: | 97.3 | 76.9 | |||||||||||
| Age:
18-21 22-25 26-29 ≥30 |
66.7
17.1 8.1 5.4 |
36.1
9.3 3.7 0 |
20.4
3.7 2.8 0.9 |
7.4
3.7 0.9 1.9 |
4.6
0.9 0.9 2.8 |
||||||||
| Programme of Study3:
Business IT & Engineering Biological & Life Sciences Education Food Science & Nutrition Law Fine Arts & Media Medicine & Allied Health Sports Science |
10.8
7.2 12.6 3.6 16.2 1.8 10.8 9.9 24.3 |
4.6
3.7 5.6 0.9 13.0 0 2.8 4.6 13.9 |
3.7
2.8 2.8 1.9 1.9 0 5.6 0 9.3 |
1.9
0.9 3.7 0.9 0 0.9 0.9 2.8 1.9 |
0.9
0 0.9 0 1.9 0.9 1.9 2.8 0 |
||||||||
- F: Frequently; O: Occasionally; R: Rarely; N: Never
- Sex vs. Relationship between Nutrition Labels & Disease: (p=0.040)
- Programme of Study vs. Awareness: (p=0.039)
- Relationship between Nutrition Labels & Disease: (p=0.026)
Table 3: Knowledge, Awareness and Understanding of Nutrition Labels among Participants (n=111)
Participants were asked a series of questions assessing the level of knowledge, awareness, attitudes and understanding of nutrition labels, specifically Traffic Light (TL) labels found on the front-of-packs (FoP) of food products. Table 3 illustrates the breakdown of the results based on various sample characteristics such as sex, age and the programme of study. It was noted that about 97% of the sample was aware of the TL label on food products, with 64% of them being females. Moreover, the awareness levels was the highest among students from sports sciences (24.3%), followed by students from food science and nutrition (16.2%) and biological & life sciences (12.6%), illustrating a significant relationship between the programme of study and awareness level of TL labels (p=0.039). Although 3% of the participants were unaware of the TL labels at the time the questionnaire was administered, it was noted that the TL label was simple and easy to comprehend.
Similarly, 93.7% of the participants, of which 61.3% were females and 32.4% males, agreed that the TL labels can help consumers make informed food choices and aid in the reduction of diet related diseases such as obesity, hypertension and diabetes (p=0.026). Based on a chi-square analysis, it was observed that there was a significant association (p=0.040) between sexes and the diet-disease relationship at 5% significance level.
With regards to level of label use among participants when purchasing food products, it has been reported that about 56.5% of the university students aged between 18 and 21 years had made use of nutrition labels frequently (36.1%) or occasionally (20.4%). The analysed data also showed that the percentage of female participants that referred to the TL labels frequently was twice as high (32.4%) compared to the male participants (16.7%). The frequent self-reported label use among female respondents can also be associated with the purchase behaviour of low-fat food products among this group; as 36% of the female respondents were willing to purchase products that had a low-fat nutrition claim as seen in Table 3. On the other hand, 17.1% of the female students claimed to have no interest in using such labels and claims to influence their food purchase decisions.
| Which has Fewer Calories? | Which is Lower in Fat? | |||
| Demographic Characteristics | Pizza 1
(1/2 of a Cooked Pizza; 661kcal; 26g Fat) |
Pizza 2
(1/4 of a Cooked Pizza; 520kcal; 17.7g) |
Pizza 1
(1/2 of a Cooked Pizza; 661kcal; 26g Fat) |
Pizza 2
(1/4 of a Cooked Pizza; 520kcal; 17.7g) |
| Percentage (%) | ||||
| Sex:
Male Female |
12.61
30.62 |
21.6
35.1 |
11.71
27.92 |
22.5
37.8 |
| Total: | 43.2%3 | 39.6%3 | ||
| Programme of Study:
Business IT & Engineering Biological & Life Sciences Education Food Science & Nutrition Law Fine Arts & Media Medicine & Allied Health Sports Science |
5.4
2.7 4.5 0.9 9.0 0 5.4 3.6 11.7 |
7.2
4.5 8.1 2.7 7.2 1.8 6.3 6.3 12.6 |
3.6
3.6 2.7 0 8.1 0.9 6.3 2.7 11.7 |
9
3.6 9.9 3.6 8.1 0.9 5.4 7.2 12.6 |
- Average No. of Correct Responses (Males): 12.15%
- Average No. of Correct Responses (Females): 29.25%
- Average No. of Correct Responses (Based on Total): 41.4%
Table 4: Ability to Analyse and Interpret Nutrition Labels in Relation to Calories and Fat Content among Participants (n=111)
While the overall self-reported rate for frequent or occasional label use during a food purchase among this demographic was about 76.9% (Table 3); the actual ability to interpret the nutrition labels correctly was much lower than the self-reported rates of label use. This was determined through the evaluation of two TL labels found on margherita pizzas, with varying serving sizes in terms of its caloric and fat content. As seen in Table 4, only about 43.2% and 39.6% of the respondents had evaluated the nutrition labels with respect to the caloric and fat content correctly. Of which, the average of 29.25% responses were recorded by the female participants while 12.15% were males. Moreover, participants from the sport sciences and food science & nutrition degrees were able to analyse the labels better than respondents from other degree programmes especially within the education and law courses. Following the data analysis using chi-square tests, it was revealed that there was no significant relationship between the self-reported rates of label use and the actual ability to interpret the labels correctly, among participants (p=0.496) at 5% significance level.
4.3 Low-fat Food Products and Consumer Preference
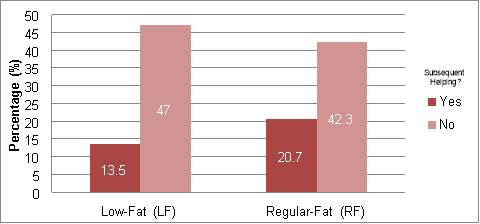
Figure 1: Relationship between Cake Preference (in terms of fat content) and helping to Subsequent Servings of Cake (n=111)
Based on a hypothetical scenario where two types of cakes were offered (low-fat and regular fat), with an option of having unlimited cake slices at no extra cost; participants were tasked to select a version of the cake they preferred and if they would have a second helping of it. Based on the results seen in Figure 1, it can be noted that 34.2% (13.5% LF; 20.5% RF) of the respondents; irrespective of the fat content stated that they would have a second helping of the cake. Of this group, 13.5% of the participants chose the low-fat cake option, while, 47% of the respondents reported that they would not go for a second helping, although they had selected the low-fat cake option. A chi-square analysis showed that there was no association between the above-mentioned variables (p=0.848).
| Demographic Characteristics | Low-Fat Cake1,2 | Regular Fat Cake1, 2 | Subsequent Helping? 2 | |
| Yes | No | |||
| Percentage (%) | ||||
| Sex2:
Male Female |
12.6
24.3 |
21.6
41.4 |
9.9
24.3 |
24.3
41.4 |
| Programme of Study1:
Business IT & Engineering Biological & Life Sciences Education Food Science & Nutrition Law Fine Arts & Media Medicine & Allied Health Sports Science |
5.4
4.5 3.6 3.6 3.6 0.9 3.6 7.2 4.5 |
7.2
2.7 9.9 0 12.6 0.9 8.1 2.7 19.8 |
5.4
0.9 7.2 1.8 4.5 0.9 2.7 2.7 8.1 |
7.2
6.3 5.4 1.8 11.7 0.9 9.0 7.2 16.2 |
- Programme of Study vs. Cake Preference: (p=0.005)
- Sex vs. the Relationship between Cake Preference and Subsequent (p=0.015)
Table 5: Participant Preference of Cake (in terms of fat content) and helping to Subsequent Servings of Cake (n=111)
According to the result breakdown in Table 5, it is apparent that the female population (24.3%) preferred low-fat cakes, while only 12.6% of the male participants chose this option. Interestingly, more females (41.4%) than males (21.6%) preferred the regular fat cake slices as opposed to the former option. In addition, 24.3% of the female respondents had noted that they will go for subsequent helpings, while only 9.9% of the male respondents selected the option of going for a second helping. An independent t-test was used to evaluate if there was any difference in the mean scores between the preference and the sex of the population; based on which a significant difference (p=0.015) was noted at a 5% significance level.
Based on the comparison between the cake preference and degree programmes, as seen in Table 5, it was observed through a chi-square analysis at 95% confidence level, that there is a significant association between the two variables (p=0.005). The majority of the participants who chose the low-fat cake option were from the medicine and allied health faculty while 12.6% and 19.8% of the participants who chose the regular-fat cake option were pursuing degrees in food science and nutrition or sports sciences.
| Demographic Characteristics | Mars | Snickers |
| Percentage (%) | Percentage (%) | |
| Sex:
Male Female |
22.5
43.2 |
11.7
22.5 |
| Total: | 65.7 | 34.2 |
| Programme of Study:
Business IT & Engineering Biological & Life Sciences Education Food Science & Nutrition Law Fine Arts & Media Medicine & Allied Health Sports Science |
9.0
5.4 8.1 3.6 8.1 0.9 9.0 5.4 16.2 |
3.6
1.8 4.5 0 8.1 0.9 2.7 4.5 8.1 |
Table 6: Type of Chocolate Bar Preferred by Participants (n=111)
In line with assessing the relationship between consumer preference on hedonic food products and the ability to interpret them based on its nutrition information; the questionnaire included a section that allowed the respondents to select a preferred chocolate bar and reason(s) for their choice (Appendix 1).
Of the 65.7% respondents who selected the Mars bar as their preferred option, 43.2% of them were females, while 22.5% of them were males as seen above in Table 6. Similarly, about 34.2% respondents selected the Snickers chocolate bar, for reasons presented in Figure 2. However, no significant relationships were observed between the sexes and the choice of chocolate bar based on a chi-square analysis (p=0.409).
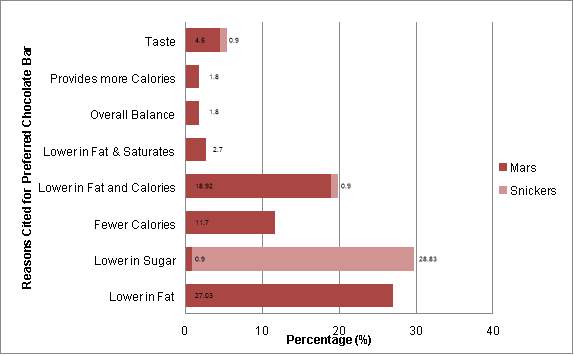
Figure 2: Comparison of Preferred Chocolate Bars and Reasons cited for Preference (n=111)
Based on the results illustrated in Figure 2, it is clear that about 27.03% and 28.83% of the participants, who selected the Mars and Snickers chocolate bar, preferred the corresponding confectionary as it was lower in fat or sugar respectively.
| Sex | Low-fat Foods are Lower in Calories? | |
| Yes | No | |
| Percentage (%) | ||
| Male | 15.3 | 18.9 |
| Female | 33.3 | 32.4 |
| Total | 48.6 | 51.3 |
Table 7: Understanding of Low-fat Nutrition Labels among Participants (n=111)
With regards to assessing the relationship between low-fat food products and its caloric content, it can be noted from Table 7 that 48.6% of the participants had perceived that low-fat products have fewer calories, while 51.3% (Male: 18.9%; Female: 32.4%) of the sample disagreed with the above statement indicating that there was no significant association between sexes and the understanding of low-fat labels (p>0.05).
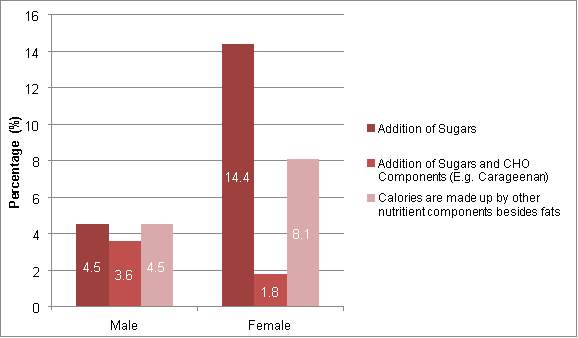
Figure 3: Reasons on why Low-fat Products does not Equate to a Lower Caloric Value among Participants
Reasons supporting the argument are illustrated above, in Figure 3, with 18.9% (Male: 4.5%; Female: 14.4%) of the respondents stating that it is due to the addition of sugars, in place of fat, raising the caloric content of the product.
4.4 Sensory Evaluation Data
| Discrimination Test | Sample Size | No. of Correct Responses | No. of Correct Responses needed for statistical significance (p=0.05) |
| Triangle Test | 43 | 16 | 20 |
Table 8: No. of Correct Responses observed in the Triangle Test using Low-fat and Regular-fat Hummus Samples
While the data collected from the sensory tests are independent of the results obtained via the questionnaires, the sensory experiment was conducted to provide an in-depth understanding of how taste can have an impact on consumer attitudes towards the nutrition information provided on a food product. The results seen in Table 8 show that, of the 43 participants who participated in the experiment only 16 respondents were able to differentiate the low-fat hummus sample from the original hummus sample. With reference to a statistical table (Appendix 8) for triangle tests, it was observed that 20 correct responses were needed for statistical significance (p=0.05). However, as there were only 16 correct responses for the triangle test, it can be noted that the participants were unable to differentiate between the two samples in terms of taste.
| Discrimination Test | Sample Size | No. of Times A/B was Selected | No. of Correct Responses needed for statistical significance (p=0.05) |
| Paired Preference Test | 43 | A (Low-fat): 25 | 26 |
| B (Reg-fat): 18 |
Table 9: Preferred Food Sample (based on the fat content) among Participants
Based on the data collected from the paired preference test, it was reported that majority of the participants preferred the low-fat hummus sample as opposed to the original sample, as seen in Table 9. However, based on the comparison against the statistical table (Appendix 9) for paired comparison tests; at least 26 participants (p=0.05) on the panel had to have the same preference for either of the samples to indicate a statistical significance in preference between the low-fat and regular fat hummus samples.
| Discrimination Test | Sample Size | No. of Correct Matches | No. of Wrong Matches | NA | No. of Correct Responses needed for statistical significance (p=0.05) |
| Paired Comparison Test (Nutrition Label Match) | 37 | 15 | 12 | 10 | 18 |
Table 10: No. of Correct Responses observed in the Paired Comparison Test (Nutrition Label Match)
Due to the mishandling of samples, the data of 37 out of 43 samples was recorded for the final leg of the sensory experiment. Based on the 37 samples, 25 samples were provided with a low-fat and regular-fat hummus sample, from which 15 participants were able to match the given TL label to the correct samples as illustrated in Table 10. According to the statistical tables (Appendix 9), at least 18 samples needed to match the labels correctly, to illustrate the relationship between taste and the perception of the food product based on the label analysis. However, since the number of correct responses fell short to be statistically significant (p=0.05), such an association could not be made.
| Discrimination Test:
Paired Comparison Test |
Sample Size | Change in Preference | No Change in Preference | No. of Correct Responses needed for statistical significance (p=0.05) |
| Change in Preference among participants with alternate samples | 25 | 13
(10: Reg-fat; 3: Low-fat) |
12 | 18 |
| Change in Preference among participants with same samples | 12 | 6
(2: Reg-fat; 4: Low-fat) |
6 | 10 |
Table 11: No. of Correct Responses observed in the Paired Comparison Test (Preference)
Following the presentation of nutrition information, participants were asked to re-evaluate their preference for the hummus samples. Table 11 shows that, from the 25 participants who had alternate samples, the preference of 13 participants changed as a result; with 10 participants stating their preference for the regular-fat hummus sample. Meanwhile among the 12 participants who had received the same samples, both of which were either low-fat or regular-fat, six participants had a change in preference, with four of them stating their preference for the regular-fat hummus sample. As the collected data had no statistical significance (p=0.05) in both categories (Appendix 9), this revealed that the presence of the low-fat nutrition labels does not influence the consumer preference.
- Discussion
- Knowledge, Awareness and Understanding of Nutrition Labels
5.1.1 Knowledge and Awareness
The present study examined the levels of knowledge, awareness and understanding of traffic light (TL) labels and low-fat nutrition claims among university students in Liverpool. It was noted that the majority of participants (97.3%, Table 3), particularly females (64%) had high levels of knowledge and awareness of the front-of-pack (FoP) TL labels as opposed to their male counterparts. These findings were also supported by evidence from previous studies that reported similar levels of knowledge and awareness on TL and GDA labels within the UK population (EUFIC; 2008; Borgmeier & Westenhoefer, 2009; Grunert et al., 2010). Moreover, greater nutritional knowledge seen among women (Vyth et al., 2010; Cooke & Papadaki, 2014) can be associated with the level of trust placed on the nutrition information and frequency of label use (Rasberry et al., 2007; Campos et al., 2011), which influences the food choices (Kreuter et al., 1997). The current study, which also looked into the relationship between the programme of study and awareness of TL labels, identified that participants who pursued science-based degrees had higher awareness levels (Table 3) potentially due to the exposure of nutrition education as part of their programme as opposed to other faculties. A statistically significant relationship between nutrition labels and disease (p<0.05) was observed in the study indicating that participants perceived that the use of TL labels can be beneficial to health (Kim et al., 2001; Rasberry et al., 2007; Smith et al., 2007) and support the reduction of diet-related diseases by guiding consumers towards healthier dietary choices.
5.1.2 Subjective and Objective Understanding
The reported levels of label use at the point of purchase (76.9%) among participants is consistent with other studies; illustrating that high prevalence for self-reported use (Cowburn & Stockley, 2005), was often above 50% (Campos et al., 2011; Tierney et al., 2017) irrespective of the study population. While, this indicates the presence of the basic understanding of nutrition labels (Levy & Fein, 1998; Grunert & Wills, 2007; Miller & Cassady, 2015), Levy and Fein (1998) identified that the level of understanding decreased with the complexity of label analysis. Although there is no statistical significance (p>0.05) between the subjective and objective understanding of labels; the current study which was the first of its kind to assess the practical skills of analysing nutrition labels among UK university students, saw a similar trend (Levy & Fein, 1998) with only 41.4% (Table 43) of the respondents being able to interpret the TL labels carefully with respect to the serving size, caloric and fat content.
Higher levels of subjective and objective understanding of TL labels among female participants is related to the purchase behaviour of low-fat food products, as fat information (Garretson & Burton, 2000; Mannell et al., 2006; Tierney et al., 2017) is commonly evaluated among the younger, female population as a result of personal preference (Campos et al., 2011) or health reasons, such as weight control (Satia et al., 2005; Rasberry et al., 2007; Vyth et al., 2010). It is also perceived to be a nutrient to be wary of, in order to stay healthy (Tierney et al., 2017). While the majority of female respondents (41.4%, Table 3) showed interest in purchasing products with low-fat claims, about 17% of them stated otherwise. This could be associated with the infrequent label reading behaviour influenced by the lack of time or motivation to evaluate such labels (Rasberry et al., 2007).
- Preference and Attitudes of Nutrition Labels
The purpose of a nutrient claim is to convey the relative value of the specific nutrient present in a product (Miller & Cassady, 2015), it can often mislead consumers because they may refer to the claim instead of the nutrition label found on the front or the back of the food product to influence their decision (Hasler, 2008). This behaviour has led consumers to believe that a product contains fewer calories based on the presence of a “low-fat” nutrient claim (Chandon & Wansink, 2006; Labiner-Wolfe et al., 2010; Wong et al., 2013; Talati et al., 2016; Szmigin & Gee, 2016). Findings from the current study also presented a similar trend that was observed in the literature. Interestingly, about half the study population (51.3%, Table 7) disagreed with the linear relationship between low-fat food products and its caloric content. This could have been influenced by the higher level of nutritional knowledge, education level (Verbeke et al., 2009; Dean et al., 2011) or the general distrust for health claims as they were perceived as a marketing message to mask the poor nutrition quality of the product (Kelly et al., 2009; Hughes et al., 2013).
Literature also suggests that consumers tend to eat a greater portion of foods with low-fat nutrient claims as it is associated with a lower level of guilt (Chandon & Wansink, 2006); which is also known as the “health halo effect” (Szmigin & Gee, 2016; Cecchini & Warin, 2016). However, the halo effect was not observed in the study population as only a third of them chose the low-fat version of the cake and the majority of participants reported that they would not consume more than a serving of the cake, regardless of the fat content. While, it was hypothesised that participants who pursued science-based degrees were more inclined to only have a serving of low-fat cake due to the greater exposure of nutrition knowledge, the results indicated otherwise; particularly with participants from sports sciences and food and nutrition courses preferring a slice of regular-fat cake. The unexpected result could have been influenced by the understanding of low-fat claims, which is related to greater energy density with the addition of other nutrient components such as sugars (Talati et al., 2016); as opposed to a product of the same category, which may be higher in fat than the former but contains comparable energy density (Szmigin & Gee, 2016).
This was also supported in the results, with participants being generally aware (Figure 3) of the replacement of nutrients (e.g. sugar) to make up for the reduction of another limiting nutrient (e.g. fat) (Talati et al., 2016; Taillie et al., 2017). The level of awareness on the sugar-fat substitution was also reflected in Figure 2, where the preference of a chocolate bar (Mars/Snickers) for the average of 27.93% respondents was based on the lower levels of fat or sugar content respectively as opposed to the comparison of the overall nutrient profile of the food product (Taillie et al., 2017). Another plausible explanation behind the majority of participants, particularly females (Table 5) indicating their preference for regular-fat cake may be associated with taste and the perception of unhealthy foods, tasting better; which in turn translates into greater pleasure (Raghunathan et al., 2006; Verbeke, 2006; Vyth et al., 2010).
Similarly, the “low-fat” label on the cake could have reduced the sensory expectations of the product due to its perceived healthiness (Raghunathan et al., 2006), skewing the participants preference towards the regular-fat cake option. The findings from the current research are in line with the evidence from previous studies, showing that consumers are more inclined to assess a hedonic food product such as chocolates, confectionary and desserts based on its sensory attributes, specifically taste instead of the nutrition quality of the product (Haddad et al., 2007; Johansen et al., 2010; Hoppert et al., 2012; Baltas et al., 2017; De Pelsmaeker et al., 2017).
While taste is an important factor in the pursuit of making healthier choices, data obtained from the sensory experiment revealed that participants did not have a taste preference despite the variation in fat content (Table 9); which was further backed up by the inability to differentiate between the samples, using a triangle test (Table 8). The absence of preference can be associated with the lack of statistical significance (p>0.05) between taste and the perception of a food product, in regards to its nutrition information (Table 10). The above findings also indicate that low-fat versions of a food product can be developed without compromising on its taste profile.
However, a change in taste preference was observed among some participants upon seeing the nutrition information of the samples (Appendix 10). Although, the change in preference, either to regular or low-fat hummus was not significant (p>0.05), the display of the TL label could have influenced the level of guilt that is associated with choosing a sample with a higher fat content (Okada, 2005; Wansink & Chandon, 2006); although the reported findings show that, the presence of nutrition information does not greatly alter consumers’ preference (Table 11) especially with hedonic food products.
- Study Limitations and Future Directions for Research
While the current study did not only assess the levels of knowledge, awareness and self-reported understanding of nutrition labels among university students in the UK, it also focused on the practical understanding of label use which was lacking in the existing literature (Rasberry et al., 2007). Although the present study was the first of its kind to evaluate the actual ability to read and interpret nutrition labels among UK university students, it had several limitations.
The study population was predominantly made up of female participants (65.8%) and a younger demographic group (18-21 years) due to the short time frame and type of sampling technique used, which could have influenced the results in the study. Based on the comparison of the sample demographic data against the data from the Higher Education Statistics Agency (HESA) (Appendix 11), the general university population in the UK was made up of more females (56.5%) than males, supporting the representation of the findings from the present study in this regard. However, as the study population was not representative in other demographic aspects, such as age and the degree programmes the participants were enrolled in; this affects the generalisability of the data across all university students. Future studies could recruit samples across universities in the UK that is representative of the general student population, to enhance the accuracy of the study (Rasberry et al., 2007; Miller & Cassady, 2015). Due to the limited amount of literature on the practical understanding and use of nutrition labels, follow-up studies could focus on this aspect within the general population as the level of self-reported label use increases with age (Campos et al., 2011) due to the increased risk of diet-related diseases (Post et al., 2010).
Similarly, improvements can also be made to the sensory experiment used in the current study. Although each section of the sensory experiment was independent of each other, the mishandling of samples could have compromised the accuracy of the results obtained during the final stage of the evaluation. This could be avoided with the samples being prepared ahead of time and ensuring that the samples are given to the respective panelists. Also, as the sensory experiment was conducted at the LJMU Food Academy (IM Marsh Campus), recruitment of participants for this component was largely restricted among students who were pursuing their degrees at that campus, limiting the overall representation of the student population.
Hence, future studies that intend to adopt a similar methodology to evaluate the impact on consumer attitudes towards nutrition information and its relationship with sensory attributes, could use a central location that provides access to students across various campuses to increase the turnout rate. In addition, the experiment could include questions on demographics such as sex, age and education to compare the data obtained through the questionnaires which can add more value to the study. Moreover, the inclusion of a qualitative component, such as the use of focus groups will provide a deeper understanding on aspects of the knowledge and attitudes on nutrition information, nutrient claims and its efficacy which cannot be interpreted from quantitative studies, from the consumers’ perspective.
- Conclusion
The findings from the present study show that, although there is a high level of knowledge, awareness and self-reported use of Traffic Light (TL) labels among university students in Liverpool; the low levels of practical understanding of labels indicate that the consumers may not be able to effectively interpret the information provided, to facilitate an informed decision especially when a nutrient claim is made on the product. While there is a great deal of evidence on the effectiveness of nutrition information such as TL labels aiding in the reduction of diet-related diseases, it is unclear how consumers will assess the nutritional quality of a food product, if the presence of a low-fat nutrient claim can mask the overall credibility of the information provided on the front or the back of a food product; due to the halo effect. However, such bias can be reduced with better educational interventions that tackle the objective knowledge on nutrition.
Appendices
Appendix 1: Questionnaire

- This is an image of a traffic light nutrition label. Have you seen the label (shown below) previously? (If YES, proceed to Q1a. If NO, proceed to Q2.)
Personal Details
Sex
Male Female
Age Group
18-21 22-25 26-29 30+
Education
Undergraduate Postgraduate
Level 4 Level 5 Level 6 Level 7 Level 8
Course of Study_____________________________________________________________________________
Yes
No
1a) If YES, how frequently do you examine the above label when purchasing food products?
Frequently Occasionally Rarely Never
- Do you think that the information provided on the nutrition label (as seen above) is easy to understand?
Yes No, Why? ________________________________________________________________
- Do you think traffic light nutrition labels can help consumers make informed food choices and aid in the reduction of diet-related diseases such as obesity, diabetes and high blood pressure?
Yes No
- Based on your understanding, obesity refers to: (Please tick ONE option only)
A person who is extremely overweight with a large amount of body fat
A person with plaque build-up inside their arteries
A person with high blood sugar levels for a prolonged period of time
A person whose abdomen is swollen due to the excessive gas production in the digestive tract
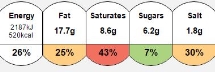
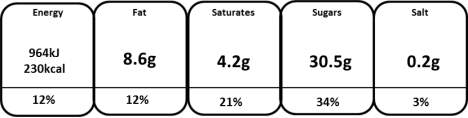
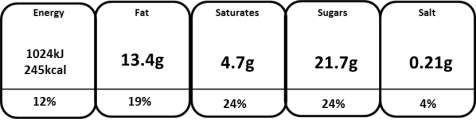
Please answer Q5a and Q5b by referring to the nutrition labels of frozen pizzas, provided below.
¼ of a cooked pizza contains
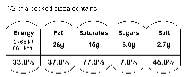
1
2
5a) Based on your understanding, which of the two pizzas is healthier in terms of calories?
1 2
5b) Based on your understanding, which of the two pizzas is lower in fat content?
1 2
Appendix 1: Questionnaire
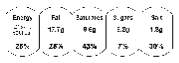
Please answer Q6 by referring to the nutrition labels of chocolate bars (serves 1) provided below.
2
1
- Based on the nutrition information provided, which of the two chocolate bars would you prefer, and why?
1 Why? __________________________________________________
2 Why? __________________________________________________
Please answer Q7 and Q8 by referring to scenario provided below.
‘You are at a restaurant presented with two types of caramel fudge cakes for dessert, one of which is lower in fat compared to the other. The waiter also informs you that you may help yourself to more than one serving (an eighth of a medium-sized cake)of the dessert at no extra cost’.
- Which of the two cakes would you choose?
Low-fat Version Regular Version
- Would you help yourself to subsequent servings of the cake?
Yes No
- Do you think that foods that are lower in fat have fewer calories?
Yes No, Why? _______________________________________________________________
- Would you purchase food products that carry a “low-fat” nutrition claim as opposed to those that do not carry such a nutrition claim? (Please tick ONE option only)
Yes, if it is similarly priced to the regular product range
Yes, even if it is slightly more expensive than the regular product range
No, due to the price range
Not interested
- Would you like to learn more about the front-of-pack traffic light nutrition labels?
Yes No
If YES, which of the following platforms would you use to find out more about the traffic light nutrition labels?
(You may TICK more than one option)
Brochures Websites Magazines TV/Radio Commercials
Newspapers Workshops/Seminars
Appendix 2.1: Generic Coding Sheet for Sensory Experiment
| Part I: Triangle Test | |
| Panel/Panelist No. | Order of Presentation |
| 1, 7, 13, 19, 25 | A-A-B |
| 2, 8, 14, 20, 26 | B-B-A |
| 3, 9, 15, 21, 27 | A-B-A |
| 4, 10, 16, 22, 28 | B-A-B |
| 5, 11, 17, 23, 29 | B-A-A |
| 6, 12, 18, 24, 30 | A-B-B |
| Part II: Paired Preference Test | |
| Panel/Panelist No. | Order of Presentation |
| 1, 7, 13, 19, 25 | A-B |
| 2, 8, 14, 20, 26 | B-A |
| 3, 9, 15, 21, 27 | A-B |
| 4, 10, 16, 22, 28 | B-A |
| 5, 11, 17, 23, 29 | A-B |
| 6, 12, 18, 24, 30 | B-A |
| Part III: Paired Comparison Test | |
| Panel/Panelist No. | Order of Presentation |
| 1, 7, 13, 19, 25 | A-B |
| 2, 8, 14, 20, 26 | A-A |
| 3, 9, 15, 21, 27 | A-B |
| 4, 10, 16, 22, 28 | B-B |
| 5, 11, 17, 23, 29 | B-A |
| 6, 12, 18, 24, 30 | B-A |
Table 12: Sample Combinations for Panelists (Sensory Experiment)
| Legend | ||
| Hummus | Sample Name | Label Matching |
| Low Fat | A | 2 |
| Regular | B | 1 |
Table 13: Legend for Hummus Samples (Sensory Experiment)
Appendix 2.2: Coding Sheet for Triangle Test
| Part I: Triangle Test | ||||||
| Panel/Panelist No. | Order of Presentation | Sample No. (Following the Order of Presentation) | Odd Sample | Correct? | ||
| 1 | A-A-B | 361 | 105 | 431 | B | N |
| 2 | B-B-A | 362 | 106 | 432 | A | Y |
| 3 | A-B-A | 363 | 107 | 433 | B | N |
| 4 | B-A-B | 364 | 108 | 434 | A | N |
| 5 | B-A-A | 365 | 109 | 435 | B | N |
| 6 | A-B-B | 366 | 110 | 436 | A | N |
| 7 | A-A-B | 367 | 111 | 437 | B | N |
| 8 | B-B-A | 368 | 112 | 438 | A | N |
| 9 | A-B-A | 369 | 113 | 439 | B | Y |
| 10 | B-A-B | 370 | 114 | 440 | A | Y |
| 11 | B-A-A | 371 | 115 | 441 | B | N |
| 12 | A-B-B | 372 | 116 | 442 | A | N |
| 13 | A-A-B | 373 | 117 | 443 | B | Y |
| 14 | B-B-A | 374 | 118 | 444 | A | Y |
| 15 | A-B-A | 375 | 119 | 445 | B | N |
| 16 | B-A-B | 376 | 120 | 446 | A | N |
| 17 | B-A-A | 377 | 121 | 447 | B | Y |
| 18 | A-B-B | 378 | 122 | 448 | A | N |
| 19 | A-A-B | 379 | 123 | 449 | B | Y |
| 20 | B-B-A | 380 | 124 | 450 | A | N |
| 21 | A-B-A | 381 | 125 | 451 | B | Y |
| 22 | B-A-B | 382 | 126 | 452 | A | Y |
| 23 | B-A-A | 383 | 127 | 453 | B | N |
| 24 | A-B-B | 384 | 128 | 454 | A | Y |
| 25 | A-A-B | 385 | 129 | 455 | B | N |
| Appendix 2.2: Coding Sheet for Triangle Test | ||||||
| 26 | B-B-A | 386 | 130 | 456 | A | N |
| 27 | A-B-A | 387 | 131 | 457 | B | N |
| 28 | B-A-B | 388 | 132 | 458 | A | N |
| 29 | B-A-A | 389 | 133 | 459 | B | N |
| 30 | A-B-B | 390 | 134 | 460 | A | Y |
| 31 | A-A-B | 361 | 105 | 431 | B | N |
| 32 | B-B-A | 362 | 106 | 432 | A | N |
| 33 | A-B-A | 363 | 107 | 433 | B | Y |
| 34 | B-A-B | 364 | 108 | 434 | A | N |
| 35 | B-A-A | 365 | 109 | 435 | B | N |
| 36 | A-B-B | 366 | 110 | 436 | A | Y |
| 37 | A-A-B | 367 | 111 | 437 | B | N |
| 38 | B-B-A | 368 | 112 | 438 | A | Y |
| 39 | A-B-A | 369 | 113 | 439 | B | N |
| 40 | B-A-B | 370 | 114 | 440 | A | Y |
| 41 | B-A-A | 371 | 115 | 441 | B | N |
| 42 | A-B-B | 372 | 116 | 442 | A | Y |
| 43 | A-A-B | 373 | 117 | 443 | B | N |
Table 14: Coding Sheet for Triangle Test (With Participants’ Response)
Appendix 2.3: Coding Sheet for Paired Preference Test
| Part II: Paired Preference Test | |||||
| Panel/Panelist No. | Order of Presentation | Sample No. (Following the Order of Presentation) | Preferred Sample (No.) | Preferred Sample (A/B) | |
| 1 | A-B | 251 | 549 | 251 | A |
| 2 | B-A | 252 | 550 | 550 | A |
| 3 | A-B | 253 | 551 | 253 | A |
| 4 | B-A | 254 | 552 | 552 | A |
| 5 | A-B | 255 | 553 | 553 | B |
| 6 | B-A | 256 | 554 | 554 | A |
| 7 | A-B | 257 | 555 | 555 | B |
| 8 | B-A | 258 | 556 | 258 | B |
| 9 | A-B | 259 | 557 | 259 | A |
| 10 | B-A | 260 | 558 | 558 | A |
| 11 | A-B | 261 | 559 | 559 | B |
| 12 | B-A | 262 | 560 | 560 | A |
| 13 | A-B | 263 | 561 | 263 | A |
| 14 | B-A | 264 | 562 | 264 | B |
| 15 | A-B | 265 | 563 | 265 | A |
| 16 | B-A | 266 | 564 | 266 | B |
| 17 | A-B | 267 | 565 | 565 | B |
| 18 | B-A | 268 | 566 | 566 | A |
| 19 | A-B | 269 | 567 | 567 | B |
| 20 | B-A | 270 | 568 | 270 | B |
| 21 | A-B | 271 | 569 | 271 | A |
| 22 | B-A | 272 | 570 | 272 | B |
| 23 | A-B | 273 | 571 | 571 | B |
| 24 | B-A | 274 | 572 | 572 | A |
| 25 | A-B | 275 | 573 | 573 | B |
|
Appendix 2.3: Coding Sheet for Paired Preference Test |
|||||
| 26 | B-A | 276 | 574 | 574 | A |
| 27 | A-B | 277 | 575 | 277 | A |
| 28 | B-A | 278 | 576 | 278 | B |
| 29 | A-B | 279 | 577 | 279 | A |
| 30 | B-A | 280 | 578 | 578 | A |
| 31 | A-B | 251 | 549 | 251 | A |
| 32 | B-A | 252 | 550 | 252 | B |
| 33 | A-B | 253 | 551 | 253 | A |
| 34 | B-A | 254 | 552 | 552 | A |
| 35 | A-B | 255 | 553 | 255 | A |
| 36 | B-A | 256 | 554 | 256 | B |
| 37 | A-B | 257 | 555 | 555 | B |
| 38 | B-A | 258 | 556 | 556 | A |
| 39 | A-B | 259 | 557 | 259 | A |
| 40 | B-A | 260 | 558 | 260 | B |
| 41 | A-B | 261 | 559 | 261 | A |
| 42 | B-A | 262 | 560 | 262 | B |
| 43 | A-B | 263 | 561 | 263 | A |
Table 15: Coding Sheet for Paired Preference Test (With Participants’ Response)
Appendix 2.4: Coding Sheet for Paired Comparison Test
| Part III: Paired Comparison Test | ||||||||||||
| Panel/Panelist No. | Order of Presentation | Nutrition Label Match | Sample No. (Following the Order of Presentation) | (In the order of 1:RF/ 2:LF) Nutrition Label Match (Sample No. *X,Y) | Nutrition Label Match (A/B) | Was it a Correct Match? (Y/N) | Preferred Sample (No.) | Preferred Sample (A/B) | Initial Preferred Sample (No.) | Initial Preferred Sample (A/B) | Has Preference Changed? (Y/N) | |
| 1 | A-B | 2, 1 | 251 | 549 | 549, 251 | B, A | Y | 251 | A | 251 | A | N |
| 2 | A-A | 252 | 550 | NA | NA | NA | 252 | A | 550 | A | N | |
| 3 | A-B | 2, 1 | 253 | 551 | 253, 551 | A, B | N | 253 | A | 253 | A | N |
| 4 | B-B | 254 | 552 | NA | NA | NA | 552 | B | 552 | A | Y | |
| 5 | B-A | 1, 2 | 255 | 553 | 255, 553 | B, A | Y | 255 | B | 553 | B | N |
| 6 | B-A | 1, 2 | 256 | 554 | 256, 554 | B, A | Y | 256 | B | 554 | A | Y |
| 7 | A-B | 2, 1 | 257 | 555 | 257, 555 | A, B | N | 257 | A | 555 | B | Y |
| 8 | A-A | 258 | 556 | NA | NA | NA | 258 | A | 258 | B | Y | |
| 9 | A-B | 2, 1 | 259 | 557 | 557, 259 | B, A | Y | 557 | B | 259 | A | N |
| 10 | B-B | 260 | 558 | NA | NA | NA | 558 | B | 558 | A | Y | |
| 11 | B-A | 1, 2 | 261 | 559 | 559, 261 | A, B | N | 261 | B | 559 | B | N |
| 12 | B-A | 1, 2 | 262 | 560 | 560, 262 | A, B | N | 262 | B | 560 | A | Y |
| 13 | A-B | 2, 1 | 263 | 561 | 561, 263 | B, A | Y | 561 | B | 263 | A | Y |
| 14 | A-A | 264 | 562 | NA | NA | NA | 562 | A | 264 | B | Y | |
| 15 | A-B | 2, 1 | 265 | 563 | 265, 563 | A, B | N | 265 | A | 265 | A | N |
| 16 | B-B | 266 | 564 | NA | NA | NA | 266 | B | 266 | B | N | |
| 17 | B-A | 1, 2 | 267 | 565 | 267, 565 | B, A | Y | 267 | B | 565 | B | N |
| 18 | B-A | 1, 2 | 268 | 566 | 268, 566 | B, A | Y | 268 | B | 566 | A | Y |
| 19 | A-B | 2, 1 | 269 | 567 | 567, 269 | B, A | Y | 567 | B | 567 | B | N |
| 20 | A-A | 270 | 568 | NA | NA | NA | 568 | A | 270 | B | Y | |
| 21 | A-B | 2, 1 | 271 | 569 | 271, 569 | A, B | N | 271 | A | 271 | A | N |
| Appendix 2.4: Coding Sheet for Paired Comparison Test
|
||||||||||||
| 22 | B-B | 272 | 570 | NA | NA | NA | 272 | B | 272 | B | N | |
| 23 | B-A | 1, 2 | 273 | 571 | 571, 273 | A, B | N | 571 | A | 571 | B | Y |
| 24 | B-A | 1, 2 | 274 | 572 | 274, 572 | B, A | Y | 572 | A | 572 | A | N |
| 25 | A-B | 2, 1 | 275 | 573 | 573, 275 | B, A | Y | 573 | B | 573 | B | N |
| 26 | A-A | 276 | 574 | NA | NA | NA | 574 | A | 574 | A | N | |
| 27 | A-B | 2, 1 | 277 | 575 | 277, 575 | A, B | N | 575 | B | 277 | A | Y |
| 28 | B-B | 278 | 576 | NA | NA | NA | 278 | B | 278 | B | N | |
| 29 | B-A | 1, 2 | 279 | 577 | 279, 577 | B, A | Y | 279 | B | 279 | A | Y |
| 30 | B-A | 1, 2 | 280 | 578 | 280, 578 | B, A | Y | 280 | B | 578 | A | Y |
| 31 | A-B | 2, 1 | 251 | 549 | 251, 549 | A, B | N | 549 | B | 251 | A | Y |
| 32 | A-A | 252 | 550 | NA | NA | NA | 252 | A | 252 | B | Y | |
| 33 | A-B | 2, 1 | 253 | 551 | 253 | A | Exclude
|
|||||
| 34 | B-B | 254 | 552 | NA | NA | NA | 552 | A | ||||
| 35 | B-A | 1, 2 | 255 | 553 | 255 | A | ||||||
| 36 | B-A | 1, 2 | 256 | 554 | 256 | B | ||||||
| 37 | A-B | 2, 1 | 257 | 555 | 555 | B | ||||||
| 38 | A-A | 258 | 556 | NA | NA | NA | 556 | A | ||||
| 39 | A-B | 2, 1 | 259 | 557 | 259, 557 | A, B | N | 557 | B | 259 | A | Y |
| 40 | B-B | 260 | 558 | NA | NA | NA | 558 | B | 260 | B | N | |
| 41 | B-A | 1, 2 | 261 | 559 | 261, 559 | B, A | Y | 261 | B | 261 | A | Y |
| 42 | B-A | 1, 2 | 262 | 560 | 262, 560 | B, A | Y | 262 | B | 262 | B | N |
| 43 | A-B | 2, 1 | 263 | 561 | 561, 263 | B, A | Y | 263 | A | 263 | A | N |
Table 16: Coding Sheet for Paired Comparison Test (With Participants’ Response)
Appendix 3.1: Score Sheet for Triangle Test (Sensory Experiment)
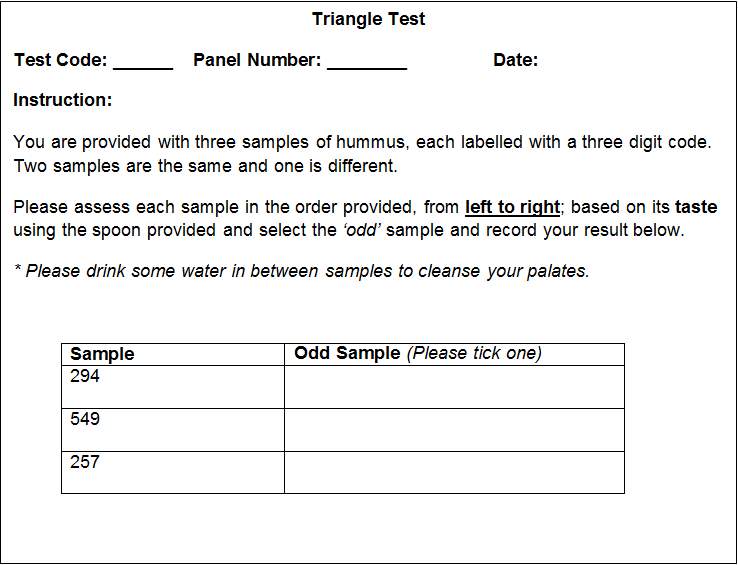
Appendix 3.2: Score Sheet for Paired Preference Test (Sensory Experiment)
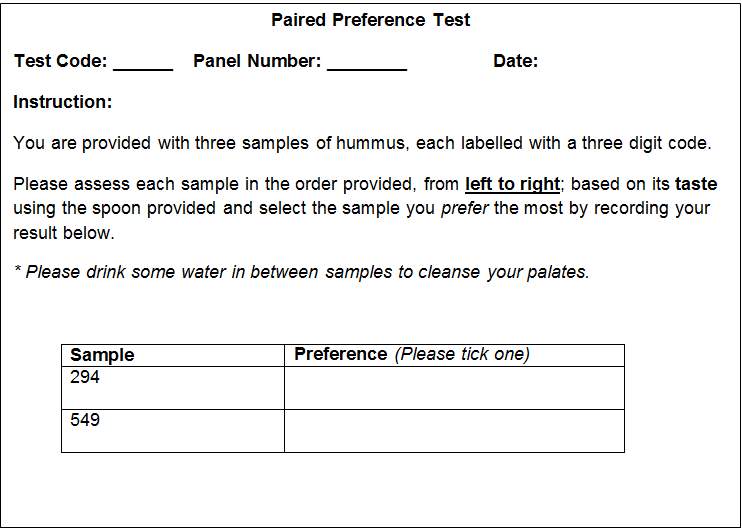
Score Sheet for Paired Comparison Test (Sensory Experiment)
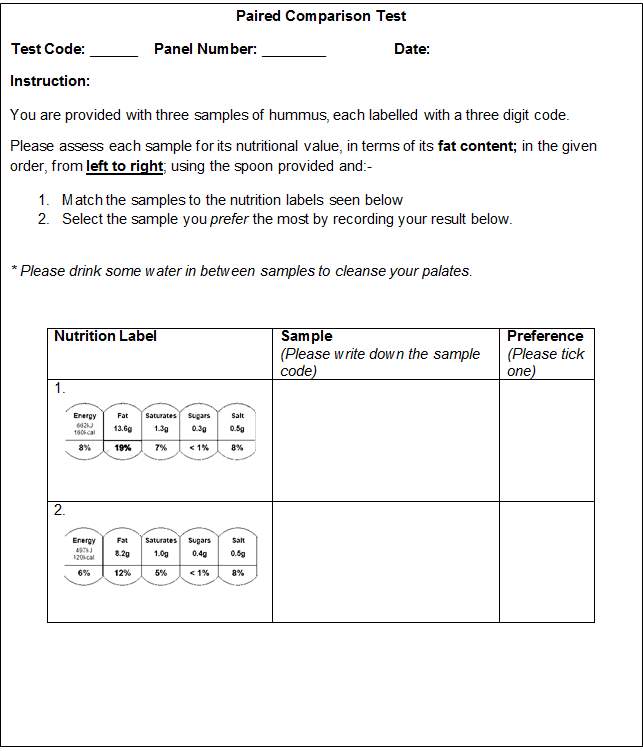
Appendix 8: Statistical Table for Triangle Test

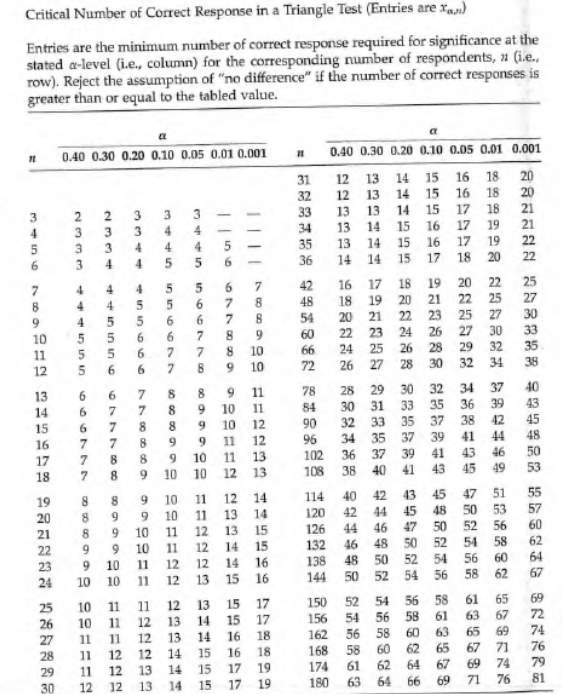
Table 17: Statistical Table for Triangle Test (p=0.05)
(Adapted from Meilgaard et al., 2016)
Appendix 9: Statistical Table for Paired Preference/Comparison Test
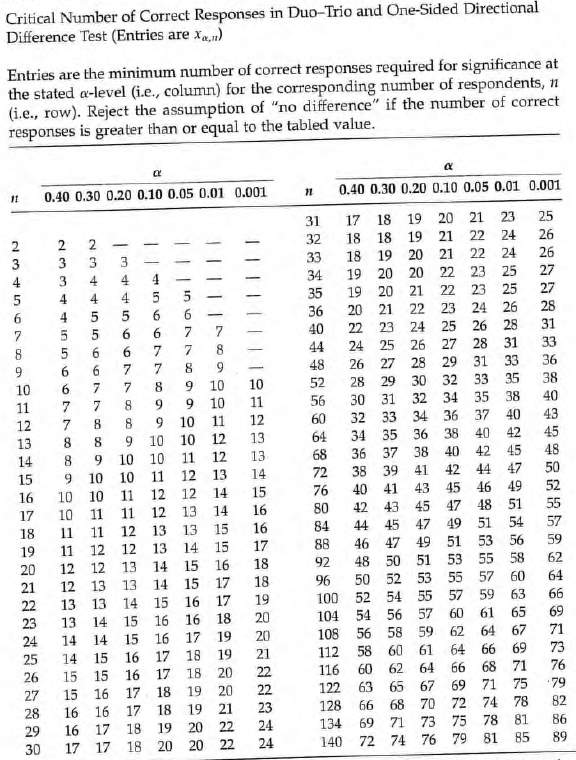
Paired Preference Test
Paired Comparison Te
Table 18: Statistical Table for Paired Preference/Comparison Test(p=0.05)
(Adapted from Meilgaard et al., 2016)
Appendix10: Nutrition Information of Hummus Samples used during Sensory Evaluation
Figure 4: Nutrition Information of Low-fat Hummus Sample
Figure 5: Nutrition Information of Regular-fat Hummus Sample
Appendix 11: Statistics on University Student Population in the UK by Higher Education Statistics Agency (HESA)
991, 670 (43.5%)
1, 288 680 (56.5%)
Figure 6: Gender Characteristics of the Representative University Student Population in the UK for the Academic Year 2015/2016 (Adapted From HESA, 2017)
Figure 7: Age Characteristics of the Representative University Student Population in the UK for the Academic Year 2015/2016 (Adapted From HESA, 2017)
Appendix 11: Statistics on University Student Population in the UK by Higher Education Statistics Agency (HESA)
Figure 8: Course Breakdown of the Representative University Student Population by Sex for the Academic Year 2015/2016 (Adapted From HESA, 2017)
References
- Aceijas, C., Waldha usl, S., Lambert, N., Cassar, S. and Bello-Corassa, R. (2016). Determinants of health-related lifestyles among university students. Perspectives in Public Health.
- Atay, Z. and Bereket, A. (2016). Current status on obesity in childhood and adolescence: Prevalence, etiology, co-morbidities and management. Obesity Medicine, 3, pp.1-9.
- Balasubramanian, S. and Cole, C. (2002). Consumers’ Search and Use of Nutrition Information:The Challenge and Promise of the Nutrition Labeling and Education Act. Journal of Marketing, 66(3), pp.112-127.
- Baltas, G. (2001). Nutrition labelling: issues and policies. European Journal of Marketing, 35(5/6), pp.708-721.
- Baltas, G., Kokkinaki, F. and Loukopoulou, A. (2017). Does variety seeking vary between hedonic and utilitarian products? The role of attribute type. Journal of Consumer Behaviour.
- Barker, D., Coggon, D. and Rose, G. (2003). Epidemiology for the Uninitiated (5th Edition). 1st ed. Oxford, GBR: Wiley-Blackwell.
- Borgmeier, I. and Westenhoefer, J. (2009). Impact of different food label formats on healthiness evaluation and food choice of consumers: a randomized-controlled study. BMC Public Health, 9(1).
- British Standards: BSI. BS 5929: Part 4 (1986). British Standard Methods for sensory analysis of foods. Part 4. Flavour Profile methods. British Standards Institution
- Campos, S., Doxey, J. and Hammond, D. (2011). Nutrition labels on pre-packaged foods: a systematic review. Public Health Nutrition, 14(08), pp.1496-1506.
- Cecchini, M. and Warin, L. (2016). Impact of food labelling systems on food choices and eating behaviours: a systematic review and meta-analysis of randomized studies. Obesity Reviews, 17(3), pp.201-210.
- Cecchini, M., Sassi, F., Lauer, J., Lee, Y., Guajardo-Barron, V. and Chisholm, D. (2011). Tackling of unhealthy diets, physical inactivity, and obesity: health effects and cost-effectiveness. The Lancet, 376(9754), pp.1775-1784.
- Choices Programme. (n.d.). Product Criteria. [online] Available at: http://www.choicesprogramme.org/about/product-criteria [Accessed 8 Mar. 2017].
- Cooke, R. and Papadaki, A. (2014). Nutrition label use mediates the positive relationship between nutrition knowledge and attitudes towards healthy eating with dietary quality among university students in the UK. Appetite, 83, pp.297-303.
- Cowburn, G. and Stockley, L. (2005). Consumer understanding and use of nutrition labelling: a systematic review. Public Health Nutrition, 8(01).
- De Pelsmaeker, S., Schouteten, J., Lagast, S., Dewettinck, K. and Gellynck, X. (2017). Is taste the key driver for consumer preference? A conjoint analysis study. Food Quality and Preference.
- Dean, M., Lähteenmäki, L. and Shepherd, R. (2011). Nutrition communication: consumer perceptions and predicting intentions. Proceedings of the Nutrition Society, 70(01), pp.19-25.
- Draper, A., Adamson, A., Clegg, S., Malam, S., Rigg, M. and Duncan, S. (2011). Front-of-pack nutrition labelling: are multiple formats a problem for consumers?. The European Journal of Public Health, 23(3), pp.517-521.
- Drichoutis A.C., Lazaridis P. and Nagya R.M. Jr. (2006). Consumers’ use of nutritional labels: A review of research studies and issues. Academy of Marketing Science Review, 2006(9).
- Drichoutis, A., Lazaridis, P. and Nagya, R. (2005). Nutrition knowledge and consumer use of nutritional food labels. European Review of Agriculture Economics, 32(1), pp.93-118.
- European Food Information Council (2008). One in Four UK consumers look for nutrition information on food labels. [Online] Available at: http://www.ibec.ie/Sectors/FDII/FDII.nsf/vPages/Regulatory_Affairs~Consumer_Information~eufic-research-on-nutrition-labelling/$file/EUFIC_PR%20250908.pdf [Accessed 8 Mar. 2017].
- Faulkner, G., Pourshahidi, L., Wallace, J., Kerr, M., McCaffrey, T. and Livingstone, M. (2014). Perceived ‘healthiness’ of foods can influence consumers’ estimations of energy density and appropriate portion size. International Journal of Obesity, 38(1), pp.106-112.
- Fedewa, M., Das, B., Evans, E. and Dishman, R. (2014). Change in Weight and Adiposity in College Students. American Journal of Preventive Medicine, 47(5), pp.641-652.
- Feunekes, G., Gortemaker, I., Willems, A., Lion, R. and van den Kommer, M. (2007). Front-of-pack nutrition labelling: Testing effectiveness of different nutrition labelling formats front-of-pack in four European countries. Appetite, 50(1), pp.57-70.
- Flick, U. (2015). Introducing research methodology. 1st ed. London: Sage.
- Fontaine, H., Crowe, T., Swinburn, B. and Gibbons, C. (2004). Two important exceptions to the relationship between energy density and fat content: foods with reduced-fat claims and high-fat vegetable-based dishes. Public Health Nutrition, 7(04).
- Garretson, J. and Burton, S. (2000). Effects of Nutrition Facts Panel Values, Nutrition Claims, and Health Claims on Consumer Attitudes, Perceptions of Disease-Related Risks, and Trust. Journal of Public Policy & Marketing, 19(2), pp.213-227.
- Godwin, S., Speller-Henderson, L. and Thompson, C. (2006). Evaluating the Nutrition Label: Its Use in and Impact on Purchasing Decisions by Consumers. Journal of Food Distribution Research, 37(1), pp.76-80.
- Graham, D. and Laska, M. (2012). Nutrition Label Use Partially Mediates the Relationship between Attitude toward Healthy Eating and Overall Dietary Quality among College Students. Journal of the Academy of Nutrition and Dietetics, 112(3), pp.414-418.
- Gropper, S., Simmons, K., Connell, L. and Ulrich, P. (2012). Changes in body weight, composition, and shape: a 4-year study of college students. Applied Physiology, Nutrition, and Metabolism, 37(6), pp.1118-1123.
- Grunert, K. and Wills, J. (2007). A review of European research on consumer response to nutrition information on food labels. Journal of Public Health, 15(5), pp.385-399.
- Grunert, K., Fernández-Celemín, L., Wills, J., Storcksdieck genannt Bonsmann, S. and Nureeva, L. (2010). Use and understanding of nutrition information on food labels in six European countries. Journal of Public Health, 18(3), pp.261-277.
- Guthrie, J., Fox, J., Cleveland, L. and Welsh, S. (1995). Who uses nutrition labeling, and what effects does label use have on diet quality?. Journal of Nutrition Education, 27(4), pp.163-172.
- Haddad, Y., Haddad, J., Olabi, A., Shuayto, N., Haddad, T. and Toufeili, I. (2007). Mapping determinants of purchase intent of concentrated yogurt (Labneh) by conjoint analysis. Food Quality and Preference, 18(5), pp.795-802.
- Hasler, C. (2008). Health Claims in the United States: An Aid to the Public or a Source of Confusion. The Journal of Nutrition, 138(6).
- Health Promotion Board. (2017). Healthier Choice Symbol. [online] Available at: https://www.hpb.gov.sg/food-beverage/healthier-choice-symbol [Accessed 8 Mar. 2017].
- Hedley, A., Ogden, C., Johnson, C., Caroll, M., Curtin, L. and Flegal, K. (2004). Prevalence of Overweight and Obesity Among US Children, Adolescents, and Adults, 1999-2002. JAMA, 291(23), p.2847.
- HESA. (2017). HESA. [online] Available at: https://www.hesa.ac.uk/data-and-analysis/students [Accessed 3 Apr. 2017].
- Hess, S., Yanes, M., Jourdan, P. and Edelstein, S. (2005). Trans Fat Knowledge Is Related to Education Level and Nutrition Facts Label Use in Health-conscious Adults. Topics in Clinical Nutrition, 20(2), pp.109-117.
- Hieke, S. and Taylor, C. (2012). A Critical Review of the Literature on Nutritional Labelling. Journal of Consumer Affairs, 46(1), pp.120-156.
- Hieke, S., Kuljanic, N., Wills, J., Pravst, I., Kaur, A., Raats, M., van Trijp, H., Verbeke, W. and Grunert, K. (2015). The role of health-related claims and health-related symbols in consumer behaviour: Design and conceptual framework of the CLYMBOL project and initial results. Nutrition Bulletin, 40(1), pp.66-72.
- Higginson, C., Kirk, T., Rayner, M. and Draper, S. (2002). How do consumers use nutrition label information?. Nutrition & Food Science, 32(4), pp.145-152.
- Hoppert, K., Mai, R., Zahn, S., Hoffmann, S. and Rohm, H. (2012). Integrating sensory evaluation in adaptive conjoint analysis to elaborate the conflicting influence of intrinsic and extrinsic attributes on food choice. Appetite, 59(3), pp.949-955.
- Huang, T., Kaur, H., McCarter, K., Nazir, N., Choi, W. and Ahluwalia, J. (2004). Reading nutrition labels and fat consumption in adolescents. Journal of Adolescent Health, 35(5), pp.399-401.
- Hughes, C., Wellard, L., Lin, J., Suen, K. and Chapman, K. (2013). Regulating health claims on food labels using nutrient profiling: what will the proposed standard mean in the Australian supermarket?. Public Health Nutrition, 16(12), pp.2154-2161.
- Hung, Y., Grunert, K., Hoefkens, C., Hieke, S. and Verbeke, W. (2017). Motivation outweighs ability in explaining European consumers’ use of health claims. Food Quality and Preference, 58, pp.34-44.
- Jensen, K., Adams, L. , Hollis, S. et al., (1996). The New Nutrition Labels: A study of consumers’ use for Dairy Products. Journal of Food Distribution Resource, 27, pp.49-57.
- Johansen, S., Næs, T., Øyaas, J. and Hersleth, M. (2010). Acceptance of calorie-reduced yoghurt: Effects of sensory characteristics and product information. Food Quality and Preference, 21, pp.13-21.
- Johnson, S. (2012). The nation’s childhood obesity epidemic: Health disparities in the making. [online] http://www.apa.org. Available at: http://www.apa.org/pi/families/resources/newsletter/2012/07/childhood-obesity.aspx [Accessed 21 Mar. 2017].
- Johnson, W., Li, L., Kuh, D. and Hardy, R. (2015). How Has the Age-Related Process of Overweight or Obesity Development Changed over Time? Co-ordinated Analyses of Individual Participant Data from Five United Kingdom Birth Cohorts. PLoS Med, 12(5), p. e1001828.
- Jones, G. and Richardson, M. (2007). An objective examination of consumer perception of nutrition information based on healthiness ratings and eye movements. Public Health Nutrition, 10(03).
- Jordan Lin, C., Lee, J. and Yen, S. (2004). Do dietary intakes affect search for nutrient information on food labels? Social Science & Medicine, 59(9), pp.1955-1967.
- Kelly, B., Hughes, C., Chapman, K., Louie, J.C.Y., Dixon, H., Crawford J., et al. (2009). Front of-pack labelling: Traffic Light labelling gets the green light. Faculty of Health and Behavioural Sciences-Papers (Arrchive)
- Kelly, T., Yang, W., Chen, C., Reynolds, K. and He, J. (2008). Global burden of obesity in 2005 and projections to 2030. International Journal of Obesity, 32(9), pp.1431-1437.
- Kemp, S., Hollowood, T. and Hort, J. (2009). Sensory evaluation. 1st ed. Chichester, U.K.: Ames, Iowa.
- Kim, S., Nayga, R. and Capps, O. (2001). Food Label Use, Self-Selectivity, and Diet Quality. Journal of Consumer Affairs, 35(2), pp.346-363.
- Kreuter, M.W., Brennan L.K., Scharff D.P., et al. (1997). Do Nutrition Label Readers Eat Healthier Diets? Behavioural correlates of adults’ use of food labels. Am J Prev Med 13, 277-283.
- Krystallis, A. and Ness, M. (2004). Motivational and Cognitive Structures of Greek Consumers in the Purchase of Quality Food Products. Journal of International Consumer Marketing, 16(2), pp.7-36.
- Kyle, T.K. and Thomas, D.M. (2014). Consumers believe nutrition facts labelling for added sugar will be more helpful than confusing. Obesity. 22(12):2481-4.
- Labiner-Wolfe, J., Jordan Lin, C. and Verrill, L. (2010). Effect of Low-carbohydrate Claims on Consumer Perceptions about Food Products’ Healthfulness and Helpfulness for Weight Management. Journal of Nutrition Education and Behavior, 42(5), pp.315-320.
- Levy, A. and Fein, S. (1998). Consumers’ Ability to Perform Tasks Using Nutrition Labels. Journal of Nutrition Education, 30(4), pp.210-217.
- Lynam, A., McKevitt, A. and Gibney, M. (2011). Irish consumers’ use and perception of nutrition and health claims. Public Health Nutrition, 14(12), pp.2213-2219.
- Lyon, D., Francombe, M. and Hasdell, T. (2012). Guidelines for sensory analysis in food product development and quality control. 1st ed. Springer, London.
- Malam, S., Clegg, S., Kirwan, S., McGinigal, S. and BMRB Social Research (2009). Comprehension and use of UK nutrition signpost labelling schemes. Food Standards Agency.
- Mannell, A., Brevard, P., Nayga, R., Combris, P., Lee, R. and Gloeckner, J. (2006). French consumers’ use of nutrition labels. Nutrition & Food Science, 36(3), pp.159-168.
- Marietta, A., Welshimer, K. and Anderson, S.L. (1999). Knowledge, Attitudes, and Behaviors of College Students Regarding the 1990 Nutrition Labeling Education Act food Labels. Journal of the American Dietetic Association, 99(4), pp.445-449.
- Martínez Steele, E., Baraldi, L., Louzada, M., Moubarac, J., Mozaffarian, D. and Monteiro, C. (2016). Ultra-processed foods and added sugars in the US diet: evidence from a nationally representative cross-sectional study. BMJ Open, 6(3), p.e009892.
- Meilgaard, M., Civille, G. and Carr, B. (2016). Sensory evaluation techniques. 1st ed.
- Mhurchu, C. and Gorton, D. (2007). Nutrition labels and claims in New Zealand and Australia: a review of use and understanding. Australian and New Zealand Journal of Public Health, 31(2), pp.105-112.
- Miller, L. and Cassady, D. (2015). The effects of nutrition knowledge on food label use. A review of the literature. Appetite, 92, pp.207-216.
- Misra, R. (2007). Knowledge, Attitudes, and Label Use among College Students. Journal of the American Dietetic Association, 107(12), pp.2130-2134.
- Monteiro, C., Moubarac, J., Cannon, G., Ng, S. and Popkin, B. (2013). Ultra-processed products are becoming dominant in the global food system. Obesity Reviews, 14, pp.21-28.
- Moskowitz, H., Beckley, J. and Resurreccion, A. (2012). Sensory and consumer research in food product design and development. 1st ed. Ames, Iowa: Blackwell Pub.
- Musingarimi, P. (2008). Obesity in the UK: A review and comparative analysis of policies within the devolved administrations. Health Policy, 91(1), pp.10-16.
- National Obesity Observatory (2012). Data Factsheet on Adult Diet. Available at: http://www.noo.org.uk/uploads/doc/vid_17669_AdultDietFactsheet_Dec2012.pdf [Accessed 07 Mar. 2017]
- Nayga, R. (2000). Nutrition Knowledge, Gender, and Food Label Use. Journal of Consumer Affairs, 34(1), pp.97-112.
- Nayga, R., Lipinski, D. and Savur, N. (1998). Consumers’ Use of Nutritional Labels While Food Shopping and At Home. Journal of Consumer Affairs, 32(1), pp.106-120.
- Ng, M., Fleming, T., Robinson, M., Thomson, B. et al., (2014). Global, regional, and national prevalence of overweight and obesity in children and adults during 1980–2013: a systematic analysis for the Global Burden of Disease Study 2013. The Lancet, 384(9945), pp.766-781.
- OECD. Overweight or obese population (indicator). 2016. doi: 10.1787/86583552-en. (Accessed on 23 June 2016) https://data.oecd.org/healthrisk/overweight-or-obese-population.htm
- Okada, E. (2005). Justification Effects on Consumer Choice of Hedonic and Utilitarian Goods. Journal of Marketing Research, 42(1), pp.43-53.
- Parmenter, K. and Wardle, J. (1999). Development of a general nutrition knowledge questionnaire for adults. European Journal of Clinical Nutrition, 53(4), pp.298-308.
- Plotnikoff, R., Costigan, S., Williams, R., Hutchesson, M., et al., (2015). Effectiveness of interventions targeting physical activity, nutrition and healthy weight for university and college students: a systematic review and meta-analysis. International Journal of Behavioral Nutrition and Physical Activity, 12(1).
- Post, R., Mainous, A., Diaz, V., Matheson, E. and Everett, C. (2010). Use of the Nutrition Facts Label in Chronic Disease Management: Results from the National Health and Nutrition Examination Survey. Journal of the American Dietetic Association, 110(4), pp.628-632.
- Public Health England. (2016). Child Obesity International Comparisons Data Factsheet. [online] Available at: https://www.noo.org.uk/securefiles/161111_1350//Child_InternationalComps_Factsheet_2016v7%20NB260916.pdf [Accessed 11 Nov. 2016].
- Public Health England. (2017). Food Labelling and packaging. [online] Available at: https://www.gov.uk/food-labelling-and-packaging/nutrition-health-claims-and-supplement-labelling [Accessed 7 Mar. 2017].
- Raghunathan, R., Naylor, R. and Hoyer, W. (2006). The Unhealthy = Tasty Intuition and Its Effects on Taste Inferences, Enjoyment, and Choice of Food Products. Journal of Marketing, 70(4), pp.170-184.
- Rasberry, C., Chaney, B., Housman, J., Misra, R. and Miller, P. (2007). Determinants of Nutrition Label Use Among College Students. American Journal of Health Education, 38(2), pp.76-82.
- Reis, H. and Judd, C. (2000). Handbook of research methods in social and personality psychology. New York: Cambridge University Press.
- Roodenburg, A., Popkin, B. and Seidell, J. (2011). Development of international criteria for a front of package food labelling system: the International Choices Programme. European Journal of Clinical Nutrition, 65(11), pp.1190-1200.
- Saba, A., Vassallo, M., Shepherd, R., Lampila, P., Arvola, A., Dean, M., Winkelmann, M., Claupein, E. and Lähteenmäki, L. (2010). Country-wise differences in perception of health-related messages in cereal-based food products. Food Quality and Preference, 21(4), pp.385-393.
- Sacks, G., Rayner, M. and Swinburn, B. (2009). Impact of front-of-pack ‘traffic-light’ nutrition labelling on consumer food purchases in the UK. Health Promotion International, 24(4), pp.344-352.
- Sandrou, D. and Arvanitoyannis, I. (2000). Low-Fat/Calorie Foods: Current State and Perspectives. Critical Reviews in Food Science and Nutrition, 40(5), pp.427-447.
- Satia, J., Galanko, J. and Neuhouser, M. (2005). Food nutrition label use is associated with demographic, behavioral, and psychosocial factors and dietary intake among African Americans in North Carolina. Journal of the American Dietetic Association, 105(3), pp.392-402.
- Scarborough P, Bhatnagar P, Wickramasinghe KK, Allender S, Foster C, Rayner M. (2011). The economic burden of ill health due to diet, physical inactivity, smoking, alcohol and obesity in the UK: an update to 2006–07 NHS costs. Journal of Public Health; 33(4): 527–535.
- Smith, S., Taylor, J. and Stephen, A. (2007). Use of food labels and beliefs about diet–disease relationships among university students. Public Health Nutrition, 3(02).
- Swinburn, B., Sacks, G., Hall, K., McPherson, K., Finegood, D., Moodie, M. and Gortmaker, S. (2011). The global obesity pandemic: shaped by global drivers and local environments. The Lancet, 378(9793), pp.804-814.
- Szmigin, I. and Gee, V. (2016). Mystification and obfuscation in portion sizes in UK food products. Journal of Business Research, 75, pp.176-184.
- Taillie, L., Ng, S., Xue, Y., Busey, E. and Harding, M. (2017). No Fat, No Sugar, No Salt . . . No Problem? Prevalence of “Low-Content” Nutrient Claims and Their Associations with the Nutritional Profile of Food and Beverage Purchases in the United States. Journal of the Academy of Nutrition and Dietetics.
- Talati, Z., Pettigrew, S., Hughes, C., Dixon, H., Kelly, B., Ball, K. and Miller, C. (2016). The combined effect of front-of-pack nutrition labels and health claims on consumers’ evaluation of food products. Food Quality and Preference, 53, pp.57-65.
- Tarabella, A. and Voinea, L . (2013). Advantages and Limitations of the Front-of-Package (FOP) Labelling Systems in Guiding the Consumers’ Healthy Food Choice. Amfiteatru Economic. XV(33)
- Tierney, M., Gallagher, A., Giotis, E. and Pentieva, K. (2017). An Online Survey on Consumer Knowledge and Understanding of Added Sugars. Nutrients, 9(1), p.37.
- Verbeke, W. (2006). Functional foods: Consumer willingness to compromise on taste for health? Food Quality and Preference, 17(1-2), pp.126-131.
- Verbeke, W., Scholderer, J. and Lähteenmäki, L. (2009). Consumer appeal of nutrition and health claims in three existing product concepts. Appetite, 52(3), pp.684-692.
- Vyth, E., Steenhuis, I., Vlot, J., Wulp, A., Hogenes, M., Looije, D., Brug, J. and Seidell, J. (2010). Actual use of a front-of-pack nutrition logo in the supermarket: consumers’ motives in food choice. Public Health Nutrition, 13(11), pp.1882-1889.
- Wang, Y., McPherson, K., Marsh, T., Gortmaker, S. and Brown, M. (2011). Health and economic burden of the projected obesity trends in the USA and the UK. The Lancet, 378(9793), pp.815-825.
- Wansink, B. and Chandon, P. (2006). Can “Low-Fat” Nutrition Labels Lead to Obesity? Journal of Marketing Research, 43(4), pp.605-617.
- Wansink, B. and Huckabee, M. (2005). De-Marketing Obesity. California Management Review, 47(4), pp.6-18.
- Wartella, E.A., Lichtenstein, A.H., and Boon, C. S. (2010). Examination of Front-of-Package Nutrition Rating Systems and Symbols: Phase I Report. Institute of Medicine. DC: National Academies Press
- Williams, P. (2005). Consumer Understanding and Use of Health Claims for Foods. Nutrition Reviews, 63(7), pp.256-264.
- Wong, C., Arcand, J., Mendoza, J., Henson, S., Qi, Y., Lou, W. and L’Abbe, M. (2013). Consumer attitudes and understanding of low-sodium claims on food: an analysis of healthy and hypertensive individuals. American Journal of Clinical Nutrition, 97(6), pp.1288-1298.
- World Health Organisation (2002). Diet, Nutrition and the Prevention of Chronic Disease. Report of WHO/FAO Expert Consultation. Technical Report Series 916. Geneva.
- World Health Organisation (2015). Fact Sheet on Obesity and Overweight. Available at: www.who.int/mediacentre/factsheets/fs311/en [Accessed 07 Mar. 2017]
- World Health Organisation (2015). Global and Regional Food Consumption Patterns & Trends. Available at: http://www.who.int/dietphysicalactivity/publications/trs916/en/gsfao_global.pdf [Accessed 07 Mar. 2017]
- Worsley, A. (2003). Consumers’ personal values andsources of nutrition information. Ecology of Food and Nutrition, 42(2), pp.129-151.
- Young, L. & Swinburn, B. (2002). Impact of the Pick the Tick food information programme on the salt content of food in New Zealand. Health Promotion International, 17(1), pp.13-19.
Cite This Work
To export a reference to this article please select a referencing stye below:
Related Services
View all


Related Content
All TagsContent relating to: "Food and Nutrition"
Food and Nutrition studies deal with the food necessary for health and growth, the different components of food, and interpreting how nutrients and other food substances affect health and wellbeing.
Related Articles

DMCA / Removal Request
If you are the original writer of this dissertation and no longer wish to have your work published on the UKDiss.com website then please: