Uranium Market Outlook
Info: 8233 words (33 pages) Dissertation
Published: 9th Dec 2019
Uranium Market Outlook
Table of contents
Table of Contents………………………………………………………………………………………………………………………………………………………..2
Overview of recent developments in Uranium prices
Future Outlook for Uranium Prices
Principal Exporters and Importers of Uranium
Major Uranium Producing Countries
Top Uranium Consuming Countries
News and developments in consumption markets
News and developments in production markets
News and developments in major companies involved in the production and trade of Uranium
List of Figures
Figure 2 – Uranium Mine Production Cost Curve 2010
Figure 3 – Estimated Global Uranium Demand
Figure 4 – Sources of Electricity Generation in Japan
Figure 6 – Uranium 5-Year Historical Monthly Spot and Futures Prices
Figure 7 – World Uranium Production, 2016
Figure 8 – World Uranium Resources
Figure 9 – Leading countries based on Uranium consumption worldwide in 2016
Figure 10 – Utility Uranium Requirements
Figure 11 – Market Share of the world’s largest Uranium producing companies in 2016
List of Tables
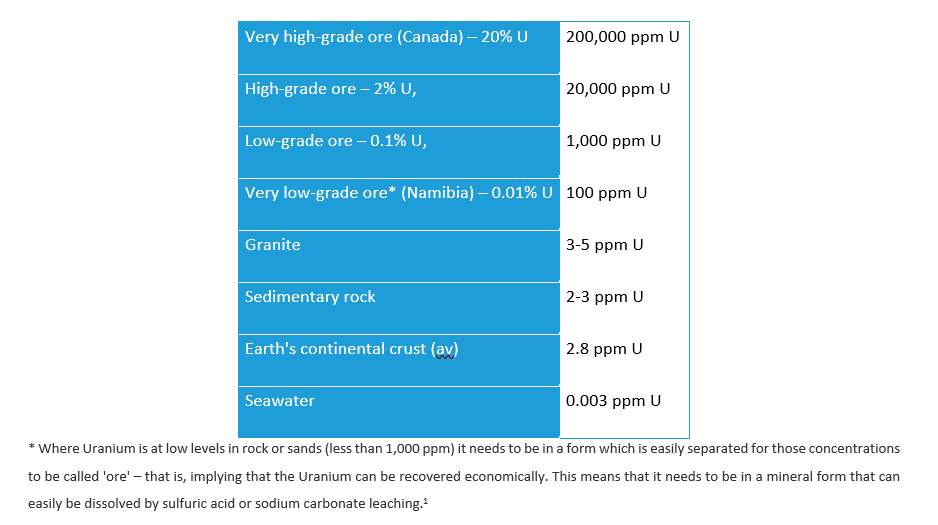
Table 1 – Uranium Concentrations………………………………………………………………………………………………………………………………5
Table 2 – Uranium Output by Producer..……………………………..……………………………………………………………………………………21
Executive Summary
The aim of this report is to examine the market for Uranium which was discovered in 1789 by the German chemist Martin Klaproth. The first part of the report examines the economic fundamentals of supply and demand and the pricing mechanism for that commodity under the prism of the most recent market developments. Subsequently, the major importers and exporters are presented. Finally, an analysis is made of the most important news and developments in principal production and consumption markets as well as in major companies involved in the production and trade of Uranium.
Uranium is a heavy metal that has been used in nuclear energy production and military arms manufacturing for over 60 years (World-nuclear.org, 2017a). Nuclear reactors produce energy by creating fission “chain reactions” which release a high amount of energy from relatively small amounts of Uranium inputs, resulting in an efficient and clean energy production. Uranium is mined in underground or open-cut mines and goes through an extensive procedure to become civilian nuclear fuel or to become refined Uranium used in military weapons creation. This commodity is also utilised for its potential to shield off devices that expose radiation. Furthermore, Uranium plays a vital part in the manufacturing of nuclear bombs, however, the production of nuclear bombs has decreased to almost zero today. Historically the largest consumption of Uranium derives from military activity, nevertheless, more recently the civilian nuclear consumption has surpassed the military consumption and now the civilian consumption acts as the main driver behind the supply and demand of Uranium.
Supply Chain
Uranium is a common element in the crust of the Earth and it is a constituent of most rocks and even found in the seabed. Furthermore, it is metallic and slightly radioactive.
Some typical concentrations of Uranium, expressed in ppm = parts per million, are:
Table 1 – Uranium Concentrations[1]
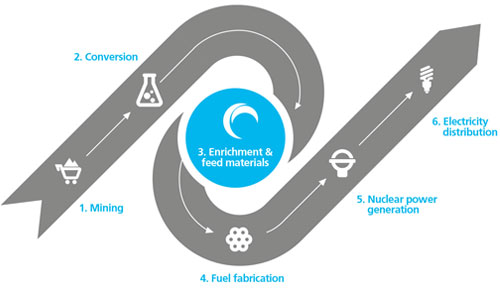
 According to World-nuclear.org (2018d), Uranium ore is extracted, purified and milled to become Uranium oxide. The last one is known as ‘yellow cake’. Then, it is chemically converted into Uranium hexafluoride (UF6), known as feed, and transported to enrichment facilities. Afterwards, the UF6 is heated, turning into a gas which feeds into the centrifuges. Furthermore, according to Urenco.com (2018), “the centrifuges split the two isotopes contained in Uranium, U235 and U238, and enrich the lighter U235 to up to 5%. Uranium is transported to fuel fabricators, where it is converted into pellets before being loaded into fuel rods. The fuel rods are transported to nuclear power stations, where they power nuclear reactors. Fuel rods are placed into the reactors, generating steam which moves turbines which in turn power generators. Nuclear power plants provide a secure source of low carbon energy, generating electricity for homes, schools, hospitals, offices and industries all around the world” (Urenco.com, 2018).
Supply
A fuel supply is cardinal to the sustainability of the energy system. The nuclear power industry has a long length of time period in comparison to other fuels (World-nuclear.org, 2017a). The time frame for a nuclear power plant from initial planning through to closure may be more than 50 years. The life cycle of a Uranium mine and mill from the beginning of exploration through production and closure takes between 20 and 40 years. Furthermore, facilities with a very large resource base may have an existence cycle of more than 50 years (International Atomic Energy Agency, 2001). So, the Uranium supply conjectures looking forward 50 years are essential for long-term planning.
Figure 2 – Uranium Mine Production Cost Curve 2010
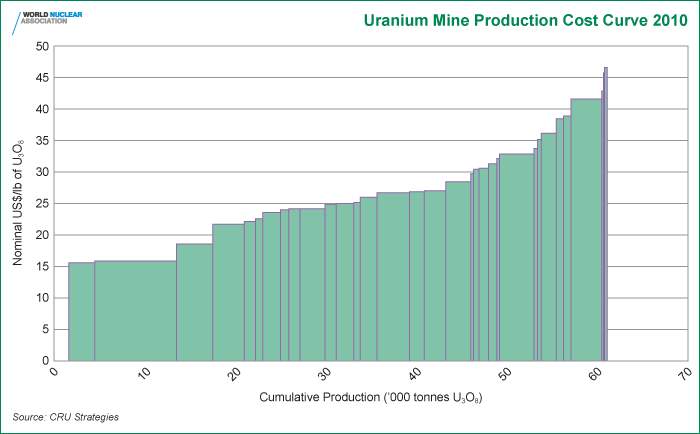
The above graph, from CRU Strategies, shows a cost curve for world Uranium producers in 2010 and suggests that for 53,500 tU/year production from mines in that year, and for 56,200 tU production in 2014, US$40/lb is a marginal price.[3]
Uranium’s supply is broadly classified into two categories: primary, in the ground resources and mine production and secondary, Low-Enriched Uranium (Down blended HEU), MOX and Depleted Uranium (Cameco.com, 2018).
Primary supply is further divided into two sub-categories — the first is not constrained or controlled by market conditions, such as production in the Commonwealth of Independent States (CIS), China and the small national programs, and the second category refers to the production that is market-based. Market-based production requirements are defined by adding secondary supply and primary supply from the CIS, China and the national programs, and subtracting this overall from annual demand (Cameco.com, 2018). Also, primary supply is further classified into identified reasonably assured resources (RAR – roughly comparable to reserves) or potential (undiscovered) resources (Cameco.com, 2018). Furthermore, primary mine production provides approximately 86% of current demand. The balance of demand is procured from secondary sources such as commercial inventories, reprocessing of spent fuel, sales by Uranium enrichers and inventories held by governments, in particular, the U.S. Department of Energy.
The surplus of the commercial inventories, which are represented the basic sources of secondary supplies from 1970 to 2000, have been consumed to a large extent. Nevertheless, the commercial inventories may gain further importance due to the closure of the German nuclear program and the extended closure of the vast majority of the Japanese nuclear fleet (Seeking Alpha, 2018). A critical source of secondary supplies remains the government inventories, especially in the U.S. and Russia. The placement of these inventories may have a market effect during the next 10 to 20 years, even though, the price and timing of these inventories inserted the market are unknown.
Demand
The demand for Uranium is highly dependent on the shifts occurring in the demand for energy. The demand for Uranium is often more predictable than for other commodities, as nuclear power plants run on cheap fuels and once these plants are built, it is cost-effective to keep them running at a high capacity (World-nuclear.org, 2018c). Especially, short-term demand can be predicted with more certainty since most of the short-term supply is already operational. Uranium demand is highly sensitive to nuclear power plant’s effectiveness and the nuclear fuel cycle (World Energy Council, 2016).
Current consumption comes mainly from the civilian sector in the form of fuel for nuclear power plants as these plants produce electricity for the civilian population. World Uranium demand increases as world population and world energy demand increase (World-nuclear.org, 2017a).
According to Marcgulescu and Marcgulescu (2016), more than a dozen countries receive over 25% of their energy from nuclear reactors. As of 2017, 30 countries are operating 449 nuclear power plants, with 60 new nuclear reactors being produced in 15 new countries (Nuclear Energy Institute, 2018). Furthermore, 165 new reactors are planned, and 315 proposed (Marcgulescu and Marcgulescu, 2016). The global nuclear energy demand is expected to grow with 26% in the period 2015 to 2025 (World-nuclear.org, 2017a), resulting in a 22% increase in Uranium demand through the decade 2020-2030 (World-nuclear.org, 2017a). According to International Energy Agency (2014), the world’s electricity demand will increase by 67% percent in 2040 compared to 2014, and as the world is looking for more clean energy, there will be plenty of demand for Uranium and clean nuclear energy in the near future. Dittmar (2013) indicates that because of nuclear energy’s small contribution to the worlds energy demand, even a small transition from fossil fuel to clean nuclear energy will result in a momentous increase in the demand for Uranium.
Figure 3 – Estimated Global Uranium Demand
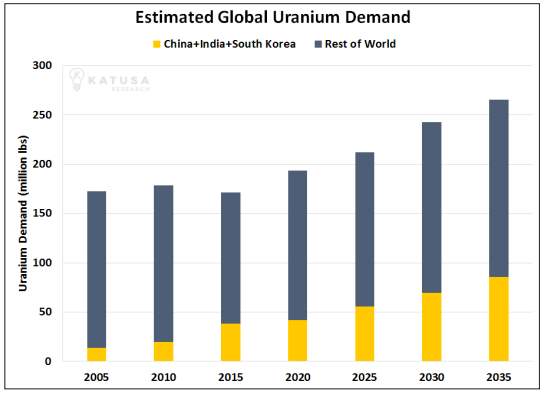
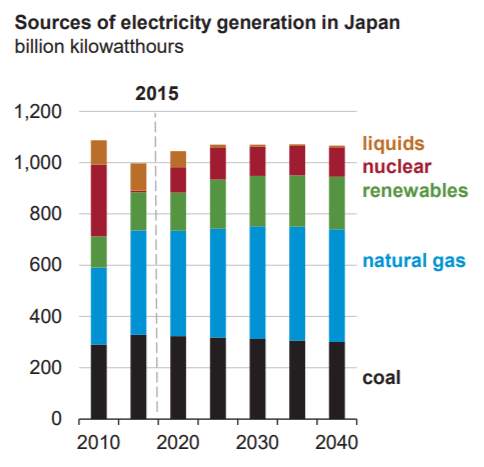
It is predicted that Uranium demand will experience a decrease within the developed nations of Europe and the Americas. However, several emerging markets in Africa and Asia, and other undeveloped nations which are searching for new effective methods to contemplate with their increasing energy demand have the possibility to adopt nuclear energy procedures which will provide them with cheap clean energy. The OECD Nuclear Energy Agency (2016) predicts that nuclear generation’s share of the energy consumption within OECD nuclear energy producing countries will decline from 25% in 2015 to less than 15% in 2040, because of governmental restrictions including those imposed within France, Sweden, and Germany (OECD Nuclear Energy Agency, 2014). Thus, the world demand will see a shift from Europe and the USA as the largest consumers to South Korea, India, and China as the new powerhouses of Uranium consumption (Figure, 3). Japan has ramped up production following the Fukushima disaster in 2011, and the Japanese demand for Uranium will rise as the generation of nuclear power plants is expected to rise to 11% by 2030 (Figure 4).
Figure 4 – Sources of Electricity Generation in Japan
Price
Overview of recent developments in Uranium prices
Uranium does not trade on an open market like most other commodities. In fact, Uranium is bought and sold usually under long-term private contracts while prices are being published by independent market consultants such as Ux Consulting and TradeTech as well as some national and international authorities in Australia, the United States and Euratom which publish price indicators to illustrate price trends for both long-term and short-term (spot price) contract arrangements.
According to OECD Nuclear Energy Agency (2016), in 2011 the Fukushima Daiichi accident served as an accelerator of an initial rapid decline in price that continued more gradually through to the end of 2014. Following the accident, reactors were shut down in Germany, Japan and the United States, thus dropping the reactor requirements considerably. Projects to increase Uranium production, implemented before the accident, resulted in increasing production even as demand softened and the market became saturated with supply, putting further downward pressure on prices through to the end of 2015. Additionally, the excess Uranium inventories and the decline in Uranium needs as a result of the substitution of enrichment (underfeeding) contributed to the further decline in Uranium prices.
Other factors that impact the Uranium price relate to macroeconomic trends. For example, the strengthening of the US dollar in 2014, especially in relation to the currencies of major Uranium producers contributed to the Uranium price volatility. In fact, foreign mining companies have benefited from the USD appreciation against their currencies, as most of their operating costs are in their domestic currencies. This allowed them to keep operating the mines despite falling Uranium market prices. The Uranium market is also sensitive to the falling oil and natural gas prices. On the supply side, lower fuel costs mean savings for Uranium producers. However, on the demand side, it can lead to premature shutdowns of operating nuclear reactors and a strong competition for potential new investments.
Moving on to present day, major Uranium producers announced substantial production cuts at the close of 2017. This included an estimated output reduction of one million pounds by Areva at its Somair mine in Niger (FocusEconomics.com, 2018). Cameco is set to suspend production at its McArthur River mine, the largest Uranium mine worldwide, for at least ten months.
Future Outlook for Uranium Prices
With regards to the longer-term outlook, there is a general consensus that nuclear growth is likely to continue. Asia and the Middle East are the most critical markets for new reactors, and new Uranium production will be needed in the coming decades. However, new Uranium supply capacity would need the right price signals for producers to make investments.
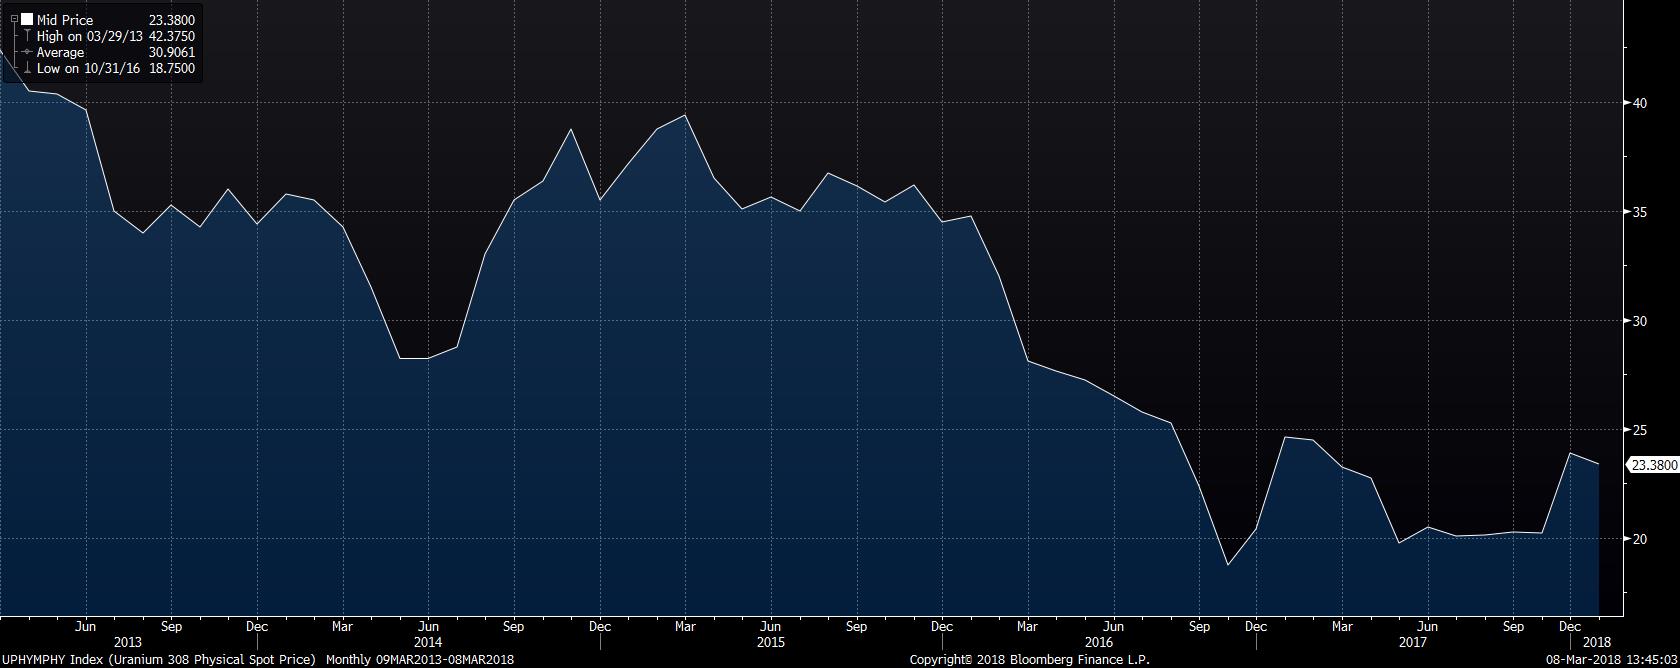
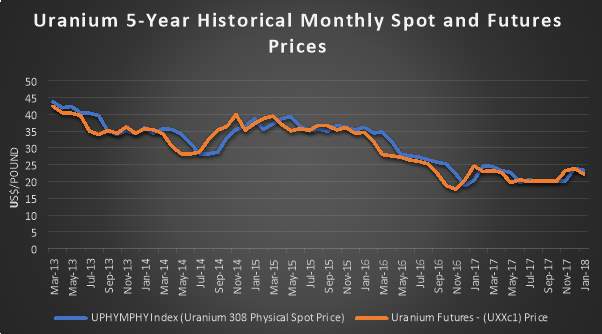
Figure 6 – Uranium 5-Year Historical Monthly Spot and Futures Prices
Principal Exporters and Importers of Uranium
Major Uranium Producing Countries
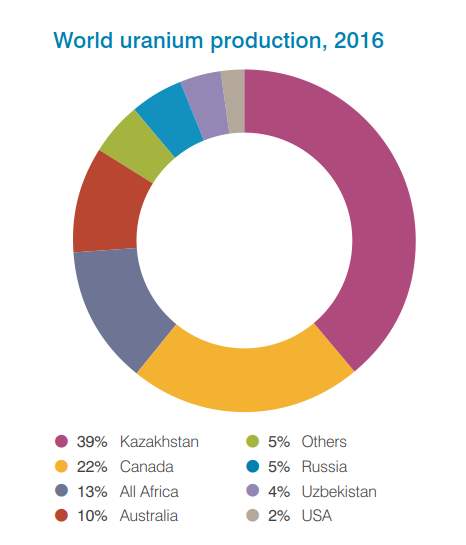
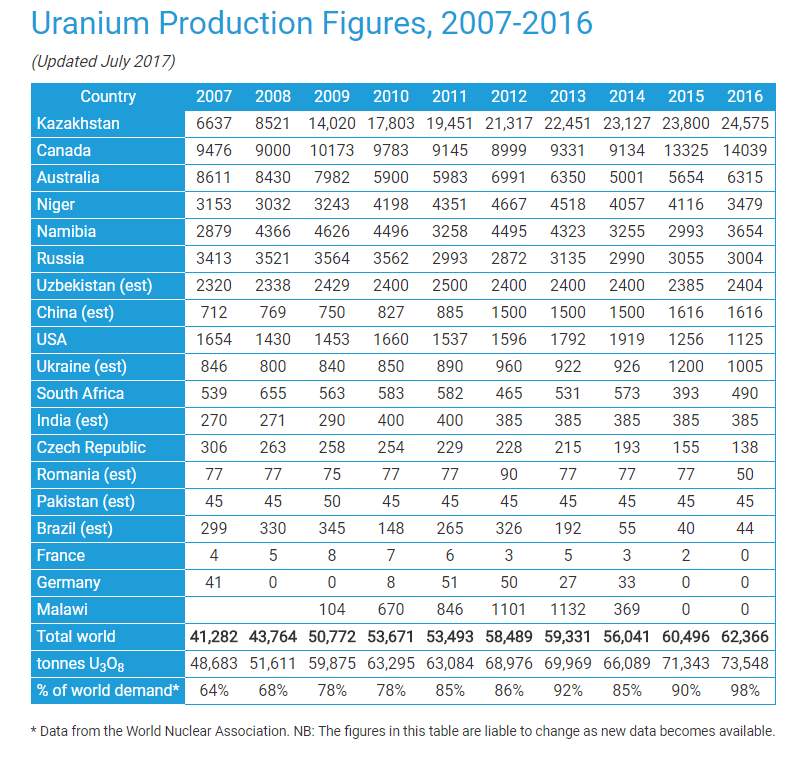
Turning now to actual world production figures, over two-thirds of the world’s production of Uranium come from mines in Kazakhstan, Canada and Australia with Kazakhstan producing the largest share of Uranium (39% of world supply from mines in 2016), followed by Canada (22%) and Australia (10%) as can be seen in the following Figure.
Figure 7 – World Uranium Production, 2016
Here is a closer look at the top 10 Uranium-producing countries based on the latest available market data from 2016 (U3o8.biz, 2018):
- Kazakhstan
Production: 24,575 tonnes
As already noted, Kazakhstan is the world’s leading producer of Uranium. The country has steadily risen in production since 2009 with 39% of world production in 2016 coming from Kazakhstan. There are plans in place by the government to build a Russian nuclear power reactor, possibly at Kurchatov, by 2025 while the country’s mine sector is continuing to expand through 2018.
- Canada
Production: 14,039 tonnes
In the past Canada used to be the largest producer of Uranium, with 22% of the global production. However, in the recent years the country occupies the second place worldwide. The production figures for 2017 are expected to be lower than those in 2016, due to the shutdowns of Cameco’s Cigar Lake mine and the McArthur River mine.
- Australia
Production: 6,315 tonnes
While Australia holds the largest Uranium resource in the world, mining bans and restrictions in various states prevent any substantial expansion of the industry. Nevertheless, Uranium production in Australia saw a significant increase in its production for 2016 compared to 2015.
4. Niger
Production: 3,479 tonnes
Niger’s production in 2016 saw a significant reduction of almost 15.5% compared to 2015. The country has two significant Uranium mines in production which jointly make up 7.5% of the world mining output from Africa’s top-grade Uranium ores. There is significant governmental support for expanding mining operations with plans in place for additional mines and prospects in the future.
5. Namibia
Production: 3,654 tonnes
Namibia’s Uranium output witnessed a substantial increase in 2016 compared to that in 2015. The country has two Uranium mines with the capability of producing 10% of the world’s output.
The country faces serious electricity challenges since the country receives half of its power from South Africa. However, Namibia’s government is interested in supplying its own electricity through new nuclear power resources.
6. Russia
Production: 3,004 tonnes
Russia is expected to increase its Uranium production in the coming years. Political and economic objectives in Russia aim to increase exports, including nuclear power plants.
With sanctions against Russia being gradually lifted, the country will likely further support its production. Currently, Rosatom State Atomic Energy, Russia’s nuclear power company, aims to be one of the top global players in the sector in spite of the western sanctions.
Figure 8 – World Uranium Resources
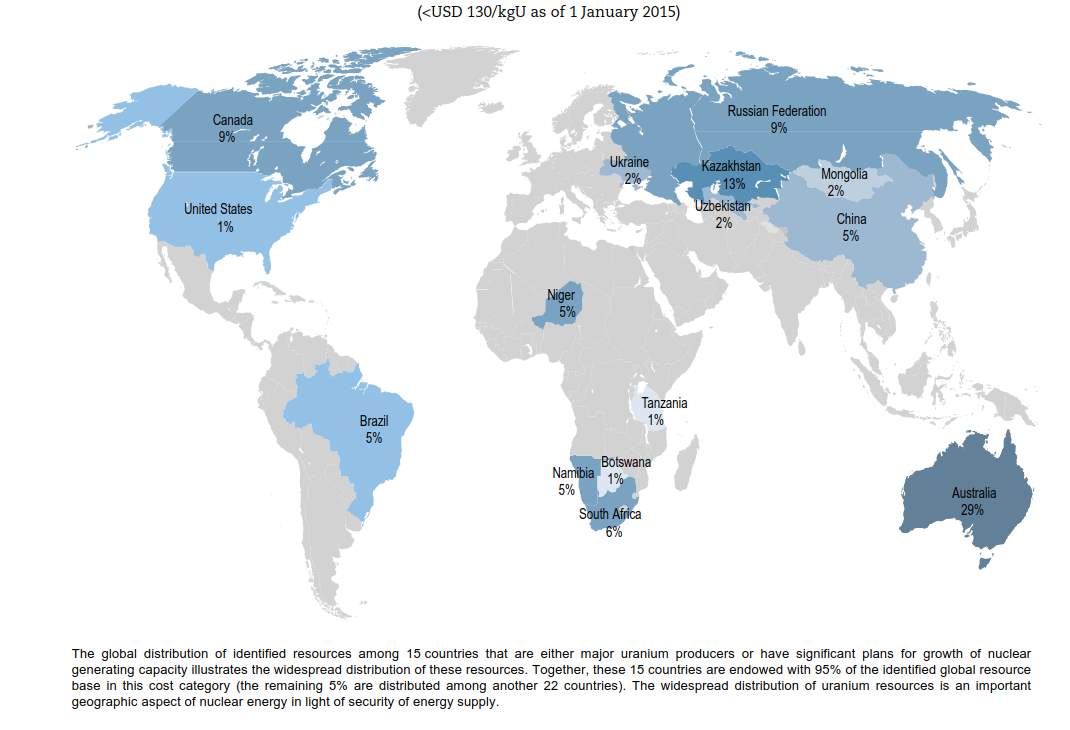
7. Uzbekistan
Mine production: 2,404 tonnes
In 2016, Uzbekistan was the seventh largest Uranium producer in the world and it is further expanding production with Japanese and Chinese joint ventures.
Navoi Mining & Metallurgy Combinat (NMMC) is part of the state holding company Kyzylkumredmetzoloto. The company handles all the Uranium-mining activities of the country. In April 2015, NMMC announced that the government had approved plans to implement 27 projects to modernize its production facilities by 2019.
8. China
Production: 1,616 tonnes
Uranium production in China was stable between 2015 and 2016. The country plans to expand its production, with many state-owned enterprises acquiring Uranium resources within China, as well as internationally.
Currently, domestic Uranium production supplies less than 25% of China’s nuclear fuel needs, and the country aims to move further towards self-sufficiency in most aspects of its fuel cycle. At the moment, 26 nuclear reactors are being built in China.
9. United States
Production: 1,125 tonnes
Uranium mining in the US continued its downward trend in output in 2016 while it is currently performed by a handful of companies, although there are a number of Uranium explorers. The White Mesa mine in Utah is fed by five underground mines and several in-situ leach operations, covering all US Uranium production.
10. Ukraine
Production: 1,005 tonnes
Last on the list is Ukraine, which saw a drop in its Uranium output from 1,200 tonnes produced in 2015 to 1,005 tonnes of Uranium produced in 2016.
Ukraine’s government plans to maintain its nuclear share in electricity production, which will involve building significantly newer nuclear reactors (U3o8.biz, 2018).
Top Uranium Consuming Countries
With regards to the top Uranium consuming countries it should be noted that Uranium is sold only to countries which are signatories of the Nuclear Non-Proliferation Treaty (NPT). The trading countries must allow international inspectors to verify that the commodity is used only for peaceful purposes. Currently, the annual worldwide consumption of Uranium is about 190 million pounds (World-nuclear.org, 2018c).
Figure 9 – Leading countries based on Uranium consumption worldwide in 2016
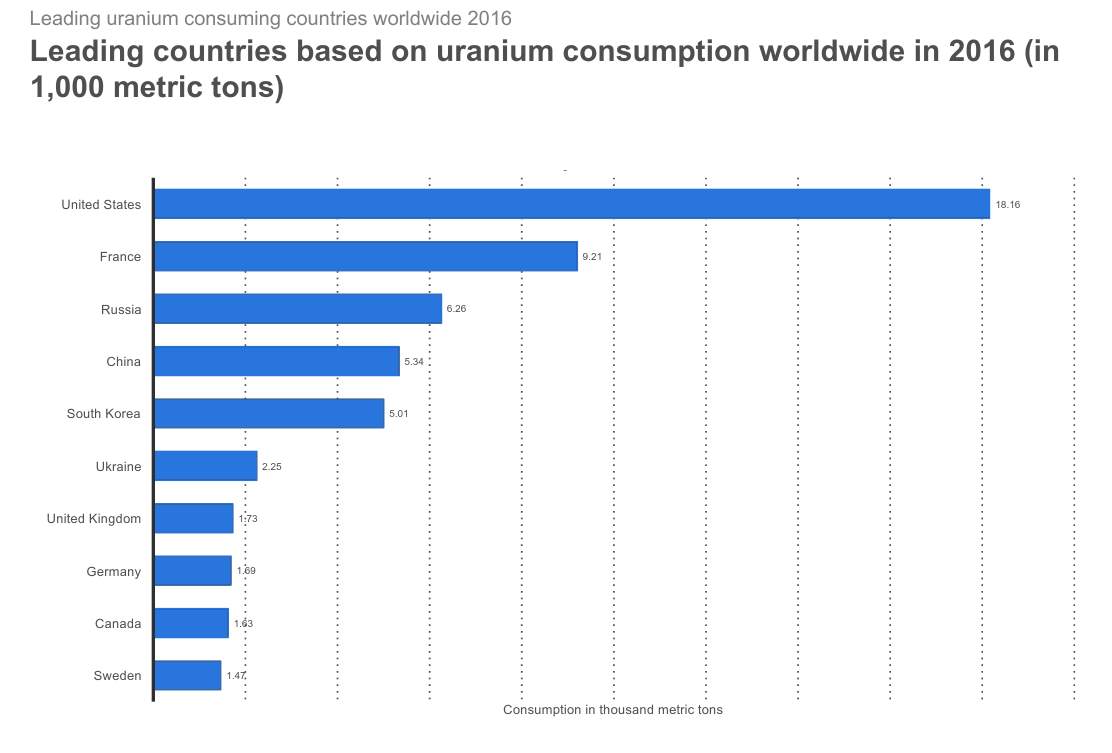
In more detail, as can be seen from the Figure above, the top consuming country of Uranium in the world for 2016 was the United States, consuming approximately 18.16 thousand metric tons of Uranium (Chepkemoi, 2018). Most of the Uranium consumed by the United States comes from Canada and it is used for fuelling nuclear reactors that are used in the generation of electricity. France is the second leading consumer, having consumed an estimated 9.21 thousand metric tons of Uranium in 2016 (ibid). France consumed half of what the United States consumed in that same year. Russia followed behind France as the third largest consuming country of Uranium in 2016 surpassing China with a consumption of 6.26 thousand metric tons, whereas Chinese consumption amounted to 5.34 thousand metric tons.
The top 10 of Uranium consuming countries for 2016 is completed with South Korea (5.01 thousand metric tons), Ukraine (2.25 thousand metric tons), United Kingdom (1.73 thousand metric tons), Germany (1.69 thousand metric tons), Canada (1.63 thousand metric tons) and, finally, Sweden (1.47 thousand metric tons)(ibid).
News and developments in consumption markets
Following the Fukushima nuclear disaster in 2011, Japan’s Nuclear Regulation Authority strengthened safety requirements for its nuclear reactors, which inclined that all Japanese reactors had to shut down to implement new regulatory safety measures (Hayashi and Hughes, 2013). During 2014, four Japanese reactors had met the regulation standards and were at the moment operational. This indicates that it is expected that more reactors will be operational and that Japanese Uranium consumption will increase after the inevitable downturn following the Fukushima disaster (OECD Nuclear Energy Agency, 2016). Although the Fukushima accident provided the world with an example of the repercussions a nuclear meltdown inflicts on the environment, several OECD members remain committed to continue or increase the nuclear power within their energy mix. Especially, the UK, Korea, Slovakia, Czech Republic, Finland, and Hungary have set in motion plans to expand their nuclear clean energy production (ibid). The US, which has the world’s largest Uranium requirements have made significant progress on new nuclear reactor projects to increase the presence of nuclear energy in their energy mix. In 2016, the US purchased 50.6 million pounds of uranium, where 11% of the Uranium where produced in the US and 89% was imported from Canada (25%), Kazakhstan (24%), Australia (20%) as the largest suppliers (World-nuclear.org, 2018b).
Germany and Belgium have implemented nuclear phase-out policies which incline that all German and Belgian nuclear power plants will close by the end of 2022 and 2025 respectively. The EU carried out stress test of the entire reactor fleet as a countermeasure to the Fukushima incident. As Germany and Belgium have decided to decrease their reactor fleet, several other countries have decided to increase their reliance on nuclear power, thus increasing the consumption of Uranium within the EU. Furthermore, EU nations are searching for alternative energy sources to decrease their reliance on Russian natural gas exports, which might act as a trigger to increase European Uranium consumption in years to come (OECD Nuclear Energy Agency, 2016).
The abundance of low-cost natural gas and subsidised renewable energy sources challenge the North American Uranium consumption (OECD Nuclear Energy Agency, 2016). Thus, limiting the short-term Uranium consumption growth within the region. Canada announced agreements to refurbish six reactors, extending their ability to operate until the 2060s. This enables Canadian nuclear power to provide 17% of Canada’s energy demand. The USA, the world’s largest consumer started the construction of two new reactors in Virginia and South Carolina, with the aim to be fully operational by 2020. As of September 2015, the US Nuclear Regulatory Commission extended three 20-year license extensions to now include 78 nuclear reactors, with 16 reactors under review (ibid). Recent low natural gas prices have led to five reactor shutdowns, and as there is at best no more than five new units coming online by 2021, thus, the North American region experience a saturated market, and close competition from other cheaper clean energy sources in their attempt to become more environmentally friendly (World-nuclear, 2018b).
The real shift in consumption is now happening, with emerging markets implementing plans and governmental offerings for new nuclear power plants, which will have a significant impact on Uranium demand. Consumption within China and India increased through 2016 as nine new reactors came online in China, and six came online in India (Meates, 2017a).
News and developments in production markets
Early in 2017, Uranium set aside the trend of other commodities (Uraniumparticipation.com, 2018). The spot prices rose on the improved fundamentals, up to the level of the Kazakhstan’s production cut announcement in January 2017 (Major, 2018). Even though these price improvements have been emboldened, the majority of the market activities are proven to be an outcome of speculative purchases by traders, and not utility procurement for reactor requirements. The important step for the recovery of Uranium prices during 2017, is the repetition of more robust utility procurement degree (ibid). Furthermore, the market exhibits an increased regarding off-market and public tenders from end-users and market observers may check if this is converted into a trend for the following years.
Figure 10 – Utility Uranium Requirements
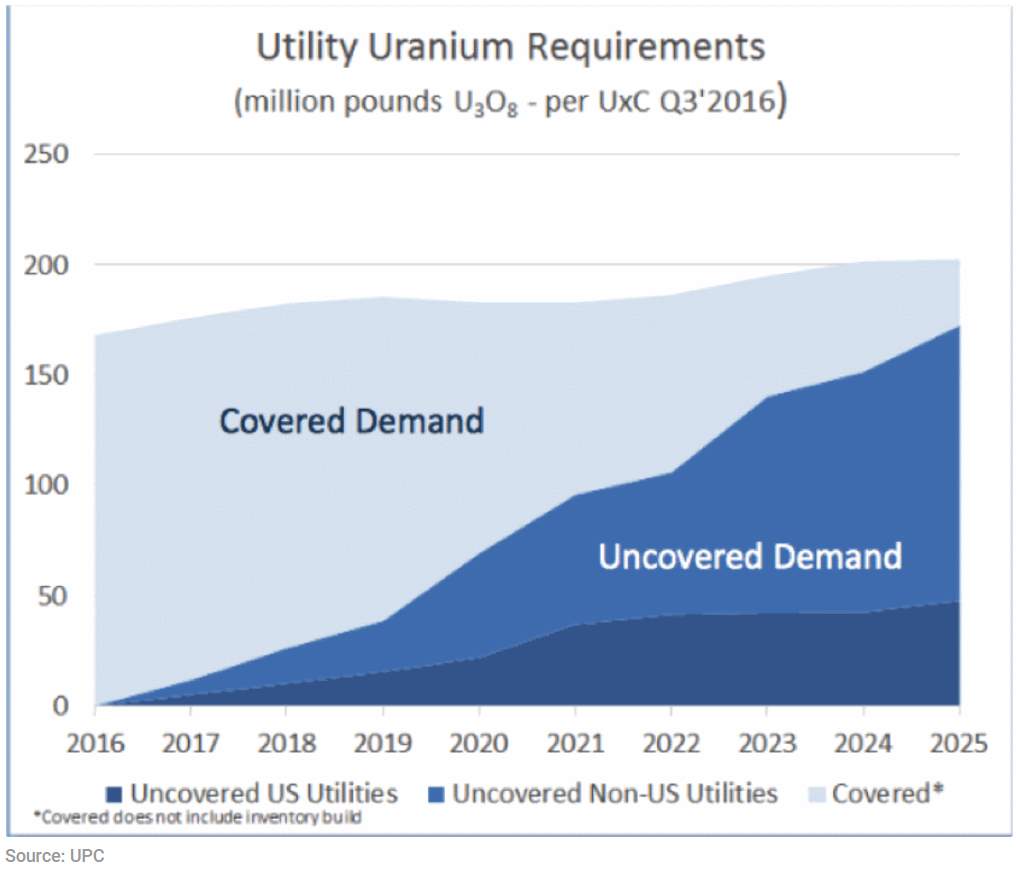
Furthermore, the considerable amount of unpledged Uranium requirements, during the following years, may occur a future procurement cycle assessing the supply side of an industry that has failed to be stimulated in order to establish the next generation of Uranium mines (ibid).Despite the fact that the Uranium market is anticipated to remain oversupplied in the short-term, the long-term growth plans for the nuclear industry, in combination with the expected reduction of Uranium resources in operation today, continue to show that a meaningful long-term supply scarcity may arise, even after new production sources are expected to come online.
Based on a sustained period of low commodity prices, the Uranium mining industry has been requested to discover the new production sources needful to meet the anticipated increase in demand the following years. This situation stays unchanged, and higher prices are expected to be needed to justify the establishment of new mines (Meates, 2017b). Due to the absence of a notable price rise in the short-term, even the most ambitious development plans may leave the market with an unavoidable supply scarcity until the 2020s.
News and developments in major companies involved in the production and trade of Uranium
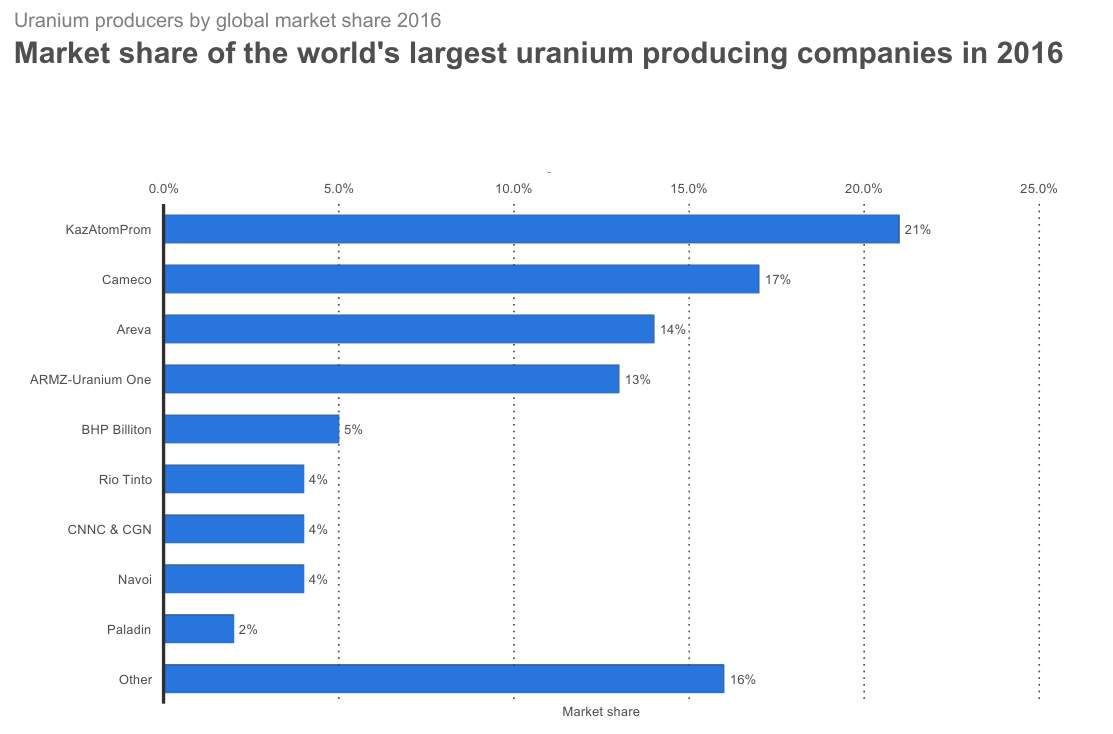
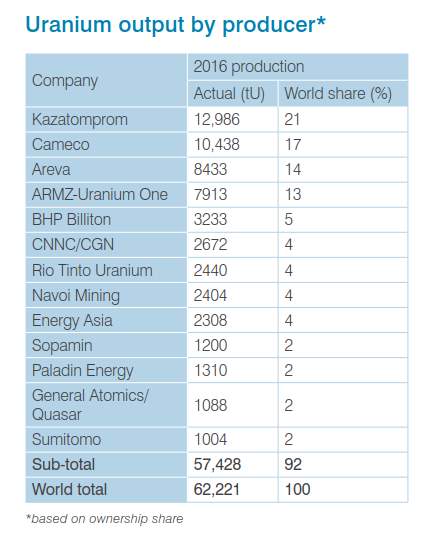
The top five companies involved in the production and trade of Uranium that accounts aggregately for approximately 70% of the world production for 2016 are in descending order in terms of production output: KazAtomProm (Kazakhstan) which accounts for 21% of the market share, Cameco (Canada) follows with 17%, Areva (now known as Orano) (France) is third with 14%, ARMZ-Uranium One (Canada) follows closely with 13% and, finally, BHP Billiton (Australia) accounts for 5% of the global market share.
Figure 11 – Market Share of the world’s largest Uranium producing companies in 2016
KazAtomProm
Kazakhstan’s state-owned Uranium producer KazAtomProm is the national operator of Kazakhstan for import and export of Uranium and nuclear fuel components for power plants. The company was founded in 1997, it is headquartered in Astana, Kazakhstan and since 2010 it is the world leader in natural Uranium production (The Atomic Company “KazAtomProm”, 2018).
Since 2015, KazAtomProm has been implementing the “Transformation Program”. In the context of the “Transformation”, the company adjusted its business processes, approved a new organizational structure, established a trading company, “TH Kazakatom AG”, to strengthen the marketing functions, and fortified effective cooperation with partners.
Finally, KazAtomProm aims to reduce Uranium production by 20% of the contract volumes within the following three years without affecting the company’s current contractual supply obligations (Ft.com, 2018). The cuts will amount to 11,000 tonnes of Uranium while the reduced output for 2018 will be equivalent to around 7.5% of total global supply.
Cameco
Cameco Corporation is the world’s largest publicly traded Uranium producer as well as a major supplier of conversion services, based in Saskatoon, Saskatchewan. In 2016, it was the world’s second largest Uranium producer, accounting for 17% of world output (Alex MacPherson, 2018). According to its most recent financial reports, the company recorded another dismal year -6th in a row- due to the depressed Uranium prices. Cameco attributed its losses primarily to low Uranium prices.
In an attempt to lower its costs, the company temporarily postponed production at its McArthur River mine and Key Lake mill in late 2017. In addition to the closure of Rabbit Lake, McArthur River and Key Lake, the company has taken other strategies to cut its costs by 30%, including layoffs at other Uranium sites and cuts at its corporate headquarters in Saskatoon(ibid).
Areva (now known as Orano)
Areva (now known as Orano) is a French international group that specializes in nuclear power and renewable energy and has its headquarters in Paris. Areva is majority owned by the French state (World-nuclear.org, 2018a).
Table 2 – Uranium Output by Producer
Areva’s has been on a downward spiral from 2011, with reactor projects in Finland (Olkiluoto 3) and France (Flamanville 3) contributing to the downturn.
In March 2015, Areva announced a two-part strategy to refocus on its core business, nuclear power, and become competitive again.
In 2017 the majority of its reactor business, Framatome (previously Areva NP), was sold to Électricité de France, while Areva will leave the new company by 2020 (ibid).
In January 23, 2018 was named Orano. With its nuclear reactor building unit sold to EdF, Orano goes back to being a pure nuclear fuel company.
ARMZ-Uranium One
Uranium One is a Canadian Uranium mining company with headquarters in Toronto, Ontario. It has operations in Australia, Canada, Kazakhstan, South Africa and the United States.
In 2010, ARMZ Uranium Holding Co. became the owner of 51.4% shares of Uranium One (Armz.ru, 2018). ARMZ Uranium Holding Co. is the mining arm of ROSATOM State Atomic Energy Corporation, one of the leaders of the global Uranium market. In 2013, the Holding, considering the situation on the global natural Uranium market, affected the transaction for consolidation of 100% of shares in Uranium One at a value of $1.3 billion and removed it from the Toronto Stock Exchange (Ebeling, 2018).
The purchase of the Uranium One by Russian interests is, as of October 2017, under investigation by the United States House Permanent Select Committee on Intelligence.
BHP Billiton
BHP Billiton is an English-Australian multinational mining, metals and petroleum dually-listed public company that has its headquarters in Melbourne, Australia. In 2017, the company ranked as the world’s largest mining company, based on market capitalization (BHP, 2018).
In 2016, BHP Billiton was the fifth-largest producer of mined Uranium and had its foot on a large resource; it quoted an orebody containing about 1.77 million tonnes of U3O8, which was about 30% of the generally quoted global resource base (ibid). Due to a number of complexities, however, Uranium in relation to BHP Billiton does not have a crucial overall value.
In that context, in August 2012, BHP Billiton announced that it was shelving its US$20 billion copper and Uranium mine expansion project in South Australia’s Olympic Dam, because of falling commodity prices and slow global economic growth. At the same time, the company announced a freeze on the approval of any major new expansion projects.
Shortly after announcing the Olympic Dam pull-out, BHP announced that it was selling its Yeelirrie Uranium Project to Canada’s Cameco. The sale was part of a broader move to step away from resource expansion in Australia.
References
Armz.ru. (2018). ARMZ Today. [online] Available at: http://www.armz.ru/eng/company/about/ [Accessed 11 Mar. 2018].
BHP. (2018). BHP Billiton | A leading global resources company. [online] Available at: https://www.bhp.com/ [Accessed 11 Mar. 2018].
Cameco.com. (2018). Supply & Demand – Markets – Invest – Cameco. [online] Available at: https://www.cameco.com/invest/markets/supply-demand [Accessed 11 Mar. 2018].
Chepkemoi, J. (2018). The Leading Uranium Consuming Countries In The World. [online] WorldAtlas. Available at: https://www.worldatlas.com/articles/the-leading-uranium-consuming-countries-in-the-world.html [Accessed 11 Mar. 2018].
Dittmar, M. (2013). The end of cheap uranium. Science of The Total Environment, 461-462, pp.792-798.
Ebeling, P. (2018). Expecting Sealed Indictments to be Opened in Clinton/Obama Uranium One Scandal – Live Trading News. [online] Live Trading News. Available at: http://www.livetradingnews.com/expecting-sealed-indictments-opened-clinton-obama-uranium-one-scandal-70200.html#.WoSlp6jFJPY [Accessed 11 Mar. 2018].
FocusEconomics | Economic Forecasts from the World’s Leading Economists. (2018). Uranium Price | Historical Charts, Forecasts, & News. [online] Available at: https://www.focus-economics.com/commodities/energy/uranium [Accessed 11 Mar. 2018].
Ft.com. (2018). Kazatomprom to slash uranium output by 20%. [online] Available at: https://www.ft.com/content/5808adb1-b430-3d19-a9ad-136a7782e427 [Accessed 11 Mar. 2018].
Hayashi, M. and Hughes, L. (2013). The Fukushima nuclear accident and its effect on global energy security. Energy Policy, 59, pp.102-111.
International Atomic Energy Agency (2001). Analysis of Uranium Supply to 2050. [online] Vienna: IAEA Austria, pp.1-122. Available at: https://www-pub.iaea.org/MTCD/Publications/PDF/Pub1104_scr.pdf [Accessed 11 Mar. 2018].
International Energy Agency (2014). World Energy Outlook 2014. World Energy Outlook. Paris: OECD / IEA, pp.1 – 725.
Investing News Network. (2018). Uranium Outlook 2018: Market Braces for Rise in Demand | INN. [online] Available at: https://investingnews.com/daily/resource-investing/energy-investing/uranium-investing/uranium-outlook/ [Accessed 11 Mar. 2018].
Mãrgulescu, S. and Mãrgulescu, E. (2016). Uranium Market Trends. Challenges of the Knowledge Society, Business aministration and marketing, pp.769-766.
MacPherson, A, S. (2018). Cameco reports $205-million annual loss as uranium prices languish. [online] Saskatoon StarPhoenix. Available at: http://thestarphoenix.com/news/local-news/cameco-reports-205-million-annual-loss-as-uranium-prices-languish [Accessed 11 Mar. 2018].
Major, D. (2018). Uranium collapse signals 2020 positive supply shock: GoviEx CEO | MINING.com. [online] MINING.com. Available at: http://www.mining.com/web/uranium-collapse-signals-2020-positive-supply-shock-goviex-ceo/ [Accessed 11 Mar. 2018].
Meates, D. (2017a). Uranium Q4, 2016 – Q1, 2017. [online] KPMG. Available at: https://home.kpmg.com/xx/en/home/insights/2017/05/uranium-q4-2016-q1-2017.html [Accessed 1 Mar. 2018].
Meates, D. (2017b). Commodity Insights Bulletin – Uranium Q2 – Q3, 2017. [online] KPMG. Available at: https://home.kpmg.com/xx/en/home/insights/2017/12/uranium-q2-2017-q3-2017.html [Accessed 11 Mar. 2018].
Nuclear Energy Institute. (2018). Statistics. [online] Available at: https://www.nei.org/resources/statistics [Accessed 1 Mar. 2018].
OECD Nuclear Energy Agency (2014). Uranium 2014: Resources, Production and Demand. Vienna: OECD.
OECD Nuclear Energy Agency (2016). Uranium 2016: Resources, Production and Demand. Vienna: OECD.
Seeking Alpha (2018). Uranium Is About To Go Nuclear. [online] Seeking Alpha. Available at: https://seekingalpha.com/article/4058243-uranium-go-nuclear [Accessed 11 Mar. 2018].
The Atomic Company “KazAtomProm”. (2018). RESULTS OF KAZATOMPROM’S ACTIVITY FOR YEAR 2017. [online] Available at: http://www.kazatomprom.kz/en/news/results-kazatomproms-activity-year-2017 [Accessed 11 Mar. 2018].
U3o8.biz. (2018). U3O8 Portal – Market Commentary – 10 Top Uranium-producing Countries – Sun Mar 11, 2018. [online] Available at: http://www.u3o8.biz/s/MarketCommentary.asp?ReportID=754347&_Title=10-Top-Uranium-producing-Countries [Accessed 11 Mar. 2018].
Uraniumparticipation.com. (2018). Uranium Participation Corp. – Financial Reports – Sun Mar 11, 2018. [online] Available at: http://www.uraniumparticipation.com/s/Financial_Reports.asp [Accessed 11 Mar. 2018].
Urenco.com. (2018). Nuclear Fuel Supply Chain | URENCO. [online] Available at: https://urenco.com/about-us/business-activity/nuclear-fuel-supply-chain/ [Accessed 11 Mar. 2018].
World Energy Council (2016). Uranium & Nuclear. World Energy Resources. [online] London. Available at: https://www.worldenergy.org/wp-content/uploads/2017/03/WEResources_Uranium_and_Nuclear_2016.pdf [Accessed 1 Mar. 2018].
World-nuclear.org. (2018a). Nuclear Power in France | French Nuclear Energy – World Nuclear Association. [online] Available at: http://www.world-nuclear.org/information-library/country-profiles/countries-a-f/france.aspx [Accessed 11 Mar. 2018].
World-nuclear.org. (2018b). Nuclear Power in the USA. [online] Available at: http://www.world-nuclear.org/information-library/country-profiles/countries-t-z/usa-nuclear-power.aspx [Accessed 1 Mar. 2018].
World-nuclear.org. (2018c). What is Uranium? How Does it Work – World Nuclear Association. [online] Available at: http://www.world-nuclear.org/information-library/nuclear-fuel-cycle/introduction/what-is-uranium-how-does-it-work.aspx [Accessed 4 Mar. 2018].
World-nuclear.org. (2018d). Uranium Supplies: Supply of Uranium – World Nuclear Association. [online] Available at: http://www.world-nuclear.org/information-library/nuclear-fuel-cycle/uranium-resources/supply-of-uranium.aspx [Accessed 11 Mar. 2018].
World-nuclear.org. (2017a). Uranium Markets: World Nuclear Association – World Nuclear Association. [online] Available at: http://www.world-nuclear.org/information-library/nuclear-fuel-cycle/uranium-resources/uranium-markets.aspx [Accessed 1 Mar. 2018].
World-nuclear.org. (2017b). World Nuclear Association Pocket Guide: Uranium – World Nuclear Association. [online] Available at: http://www.world-nuclear.org/our-association/publications/pocket-guides/pocket-guide-uranium.aspx [Accessed 13 Mar. 2018].
APPENDIX 1
Uranium 5-Year Historical Monthly Prices as per UPHYMPHY Index (Uranium 308 Physical Spot Price) and Uranium UXXc1 Futures Monthly Prices expressed in US$/Pound [14]
APPENDIX 2
Uranium Production Figures, 2007-2016[15]
[1] Source: World-nuclear.org. (2018). Uranium Supplies: Supply of Uranium – World Nuclear Association.
[2] Source: Urenco.com. (2018). Nuclear Fuel Supply Chain | URENCO.
[3] Source: World-nuclear.org. (2018). Uranium Markets: World Nuclear Association
[4] Source: Investing News Network (2018). Uranium Outlook 2018: Market Braces for Rise in Demand
[5] OECD Nuclear Energy Agency (2016) Uranium 2016: Resources, Production and Demand
[6] 5-Y UPHYMPHY Index – Uranium 308 Physical Spot Price (Bloomberg Data)
[7] Source: Bloomberg Data
[8] Source: World-nuclear.org (2017b) World Nuclear Association – Pocket Guide: Uranium
[9] OECD Nuclear Energy Agency (2016) | Uranium 2016: Resources, Production and Demand
[10] Source: World Atlas – The leading Uranium consuming countries in the world
[11] Source: Mining.com – Uranium collapse signals 2020 positive supply shock: GoviEx CEO
[12] Source: World Nuclear Association – World Uranium Mining Production
[13] Source: World Nuclear Association – World Uranium Mining Production
[14] Source: Bloomberg Data
[15] Source: World-nuclear.org (2018)
Cite This Work
To export a reference to this article please select a referencing stye below:
Related Services
View all


Related Content
All TagsContent relating to: "Chemistry"
Chemistry is a science involving the study of the elements and matter at the atomic and molecular level including their composition, structure, properties, behaviour, and how they react or combine.
Related Articles

DMCA / Removal Request
If you are the original writer of this dissertation and no longer wish to have your work published on the UKDiss.com website then please: