Improving Measurement and Understanding of Brain Activity
Info: 9501 words (38 pages) Dissertation
Published: 17th Jun 2021
Abstract
Visual evoked potentials (VEP) are the answers of the nervous system following the stimulation of Human visual field. They are used for the diagnosis of several neural pathologies (Parkinson, Multiple Sclerosis, Epelipsy,…). These biological signals are recorded by three electrodes placed on the scalp. Their amplitudes are very weak and their frequencies are very low. They are greatly buried in background noise which the nature is not well defined. For this reason, powerful tools are needed to extract and exploit the meaningful information they contain. This final project work aims to provide a contribution to better understanding and interpretation of cerebral activity in humans via the improvement of the quality of plots of the recorded signals. Its objective is to conceive and apply adaptive filtering methods as alternative to the classical averaging technique which is used in clinical practice to achieve the true VEP extraction. The obtained results show a good improvement of the signal to noise ratio while applying LMS based adaptive filter in both normal and pathological cases. However, it still very slow in terms of speed time convergence compared to RLS adaptive method. The programmed filters are of order 21 and use the averaged normal VEP signal as reference input. Both of LMS and RLS algorithms were found better to achieve the filtering task on the basis on only 5 to 10 VEP single sweeps.
Key words: Adaptive Filtering, Averaging Method, Least Mean Square (LMS), Recursive Least Squares (RLS), Signal-to-Noise Ratio (SNR), Visual Evoked Potentials.
Table of Contents
Part I: Visual Evoked Potentials
2. Definition of visual evoked potentials
3.2.2. The amplification device
3.2.3. The analog-to-digital conversion card
4. Visual Evoked Potential Test
Part II: Linear and Nonlinear Filtering Methods
3. Principle of adaptive filtering
3.1. Adaptive filtering theory
4.1. Adaptive Filter’s settings
4.2. Results obtained in normal case
4.3. Results obtained in pathological case
List of Figures
Figure 1 : Waveform of VEP signal in normal case [3].
Figure 2: VEP data acquisition chain diagram [4].
Figure 3 : Some colored stimuli used for recording VEP [4].
Figure 4 : Electrode electronic diagram [10].
Figure 5: International 10/20 System for positioning EEG recording electrodes.
Figure 6: Basic VEP amplifier circuit diagram [12].
Figure 7: Adaptive filter block diagram.
Figure 8 : Mean square error Vs Order of the adaptive filter.
List of Tables
Table 1. Elapsed time and SNR mean value corresponding to normal case.
Table 2. Elapsed time and SNR mean value corresponding to pathological case.
Table 3. Complexity comparison of LMS and RLS algorithms
Introduction
Electroencephalography is a method for recording the differences in potential generated by spontaneous biochemical and electrical activity inside the brain. It uses a helmet of flat electrodes placed on the scalp and results in a plot called electroencephalogram (EEG). EEG is used for the diagnosis of many severe brain disorders (Epilepsy, Multiple sclerosis, Parkinson, ...). However, it can be replaced by using evoked potentials (EP) for the diagnosis of specific neuronal pathologies. Indeed, PE represents the perturbations caused by the natural electrochemical activity of the nervous system (EEG) during the presence of an external sensory excitation. The evoked potentials constitute a simple and effective method in the diagnosis of several pathologies affecting the nervous pathways of the stimulated sensory modality, either at the level of the sensory nerve or at the level of the central nervous system. In the case where the visual field is excited, the nervous system response is called visual evoked potential (VEP). Evoked potentials can be recorded using only three electrodes placed on the scalp. These signals are characterized by very low amplitudes and low frequencies. They are buried in noise which requires the use of powerful tools to extract and exploit the meaningful information they contain. In clinical practice, VEPs are extracted using the averaging technique. It consists in computing the mean of recorded single sweep during the whole duration of the test. This operation still going on until a clear and exploitable plot of the VEP is obtained. In theory, the averaging technique assumes that the recorded VEP signals are stationary and that the noise in which they are embedded is additive and uncorrelated from one single VEP Trial to another. However, these hypotheses are not all satisfied because the VEP is characterized by its non-stationary and the characteristics of the noise is still being studied. Therefore, we cannot attest that this method is reliable. These findings have prompted researchers to develop other VEP processing methods and algorithms to make it easier and more efficient to extract, and thus its use in the diagnosis of neurological diseases is much more effective and reliable. In this work, we propose the application of adaptive linear methods to VEP signals. We will compare the performance of each filter in order to select which one is the most suitable for processing this type of signal. This report will be presented in two parts. In the first one, we give a clinical definition of VEP, describe their stimulation and acquisition systems before describing the procedure followed in clinical practice during VEP tests. In the second part, we present the adaptive filtering algorithms used in our project. Also, it will be devoted to the presentation and discussion of the obtained results. We will conclude with a general conclusion summarizing the various statements and results contained in it. We will give some possible perspectives concerning the analysis of VEPs.
Part I: Visual Evoked Potentials
1. Introduction
The evoked potentials (EP) are the responses of the nervous pathways that occur as a result of successive stimulations. Indeed, they represent the perturbations of the natural electrochemical activity of the nervous system (EEG) during the presence of an external sensory excitation. Among the different types of EP, we distinguish:
- Auditory evoked potentials (AEP);
- Somatosensory evoked potential (SEP);
- Event-Related Potential (ERP);
- Visual evoked potentials (VEP) [1, 2].
We are interested in this report to visual evoked potentials. The evoked potentials are characterized by their very low amplitudes (a few microvolts) and low frequency ranges. These signals are strongly buried in a background noise resulting from the existence of the spontaneous bioelectric activity of the brain whose amplitude is much greater compared to that of the EP. This is why it is necessary to use specialized data acquisition equipment to record and to extract useful signals from the unwanted spontaneous electrical activity of the brain [3, 4]. The evoked potentials constitute a simple and effective method in the diagnosis of several pathologies affecting the nervous pathways of the stimulated sensory modality, either in the sensory nerve or in the central nervous system [3, 4]. Their use has become more and more frequent thanks to technological advances in electronics and computing which have made acquisition and processing of EP much easier. To better understand the role of evoked potentials and more specifically the visual evoked potentials in the diagnosis of certain pathologies, we present in next paragraphs, their clinical definition; then we describe the VEP stimulation and data acquisition systems. At the end of the chapter, we will describe the procedure followed during the VEP tests.
2. Definition of visual evoked potentials
Visual evoked potentials (EVPs) are the answer of the nervous system following stimulation of the patient's visual field. Several variants of VEP exist depending on the used stimuli. However, we distinguish three main types of VEP defined by the stimulations used in clinical practice:
- Pattern reversal VEP;
- Pattern onset/offset VEP;
- Flash VEP.
The characteristics of the stimuli are described in the "VEP Standard 2004" of International Society for Clinical Electrophysiology of Vision (ISCEV) [5, 6]. VEPs are used to assess the integrity of visual pathways from the eye to the occipital areas in the brain. Indeed, in the case of ophthalmology, the VEPs serve as a complementary examination for the diagnosis of any sudden decrease in visual acuity and / or to search for damage of the optic nerve, as in the case of an attack by multiple sclerosis. They are more widely used in neurology for diagnosis of neurological diseases that have an impact on optical pathways or intra cerebral lesions such as atrophy and optic neuritis, the existence of tumors on the visual pathways, epilepsy, multiple sclerosis, etc. [4]. VEPs are weak low-frequency signals. Their amplitude varies from one person to another even among the normal subjects and its value varies typically from a few microvolts to a few tens of microvolts and their frequency does not exceed 300 Hz [3, 4]. A normal VEP has a standard shape in amplitude and time, and any neurophysiological involvement is reflected by the presence of an anomaly on the recorded signal [5, 6]. The figure 1 below shows the typical normal VEP signal. 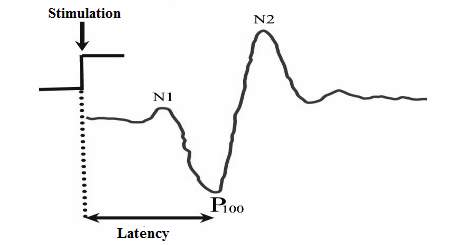 Figure 1 : Waveform of VEP signal in normal case [3]. The VEP is characterized by the succession of three major waves whose nomination is standardized according to the time of their appearance after the excitation. These three waves are, in the order of their appearance:
- The N70 wave (N1): it appears at around 70 to 75 milliseconds after the excitation. This negative wave is polarized and its polarity (negative or positive) reflects certain independence between the two hemispheres of the brain during its generation [1, 5, 6].
- The P100 wave: It is the first dominant peak of the VEP. Its time of appearance corresponds to the latency of the nervous system. It is the time that elapses between the perception of stimulation and the reaction of the brain; manifested by the appearance of this first dominant peak of the recorded signal. The measurement of the latency makes it possible to have information on any attack of the myelin of the optical nerves. The P100 is repeatable in VEP signals but it changes from one subject to another among the majority of normal cases. Therefore, the standard provides for a 20 millisecond margin on its measurement [1, 3, 4, 5, 6].
- The N170 wave (N2): This wave is often used in the study of the process of structural encoding of faces. Studies have revealed the existence of these bilateral occipito-temporal negativities, which culminate at 150 to 200 milliseconds, and are particularly ample in response to face stimulations as compared to other visual objects. [1, 5, 6, 7].
The amplitudes and time of occurrence of these peaks can be measured directly from the signal. The peak amplitude can be evaluated either peak-to-peak or from the baseline to peak [3, 4].
3. Recording VEP
In clinical practice, the recording of evoked potentials is carried out by means of a helmet fitted with flat silver electrodes placed on the scalp. However, for VEP data acquisition, we need only three electrodes to be placed on the patient's scalp, two of which will be used to pick up bioelectrical signals and the third will be taken as a reference electrode [5, 6, 8]. As mentioned above, VEPs have very low amplitudes and are low frequencies. They are buried in an interference resulting mainly from the spontaneous activity of the brain. For this reason, the VEP data acquisition chain must be efficient in extracting the useful signal. In general, this acquisition chain can be divided down into three main modules:
- Stimulation module;
- Electronic data acquisition module;
- VEP software module.
Such data acquisition chain can be illustrated in Figure 2 below [4]. 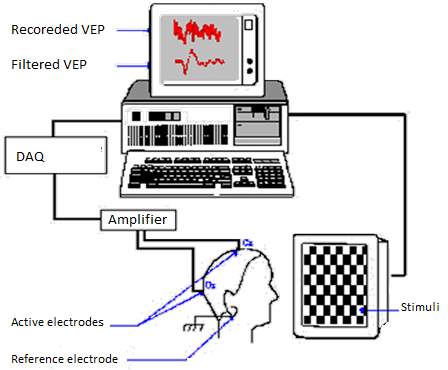 Figure 2: VEP data acquisition chain diagram [4].
3.1. Stimulation Module
This module consists of a simple screen on which will be presented the stimuli to the subject. Two classes of stimuli are used in clinical practice:
- Pattern stimulation: Two major forms of stimulation fall under this class: pattern reversal stimuli and pattern-onset/offset stimuli. The most used pattern is a checkerboard in black and white. The first model consists in alternating the phase of the tiles of the checkerboard with a specific frequency, provided that the total luminance of the screen does not change. The second model consists of passing, suddenly, from a black screen to the presentation of a pattern [5, 6, 8, 9]. According to guidelines, the measurement of pattern stimulus luminance should be expressed in candelas per meter squared (cd.m−2). It is recommended to have a minimum value of 80 cd.m−2 for the white areas luminance. This last should be uniformly distributed between the center and the periphery of the visual field without, however, exceeding a variation of 30% [5, 6, 8]. It is noticed that colored stimuli can be used in some special cases. The following figure 3 shows some of used colored patterns.
- Flash stimulation: This type of stimulation is strongly used when the involvement of the subject is not necessary, such as in vision tests for babies, or when it is necessary to carry out tests to unconscious patients [5, 6, 8]. In this case, the patient is stimulated less than 1.5 times by a flash, which subtends a visual field of at least 20°. The recommended flash stimulus strength range is [1.5–3 cd.s.m−2] with a background of 15 to 30 cd.m−2 [5, 6, 8].
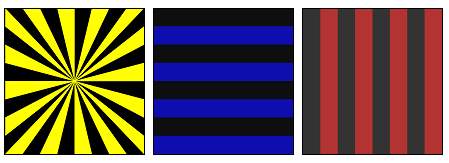 Figure 3 : Some colored stimuli used for recording VEP [4].
3.2. Data acquisition module
This module is composed of three main components which are:
3.2.1. Recording electrodes
The recording of the EPs requires at least the use of three silver-silver chloride or gold disc surface flat electrodes which the impedances should not exceed 5KΩ in order to reduce electrical interference. Indeed, the electrode’s impedance permit to reduce the interference with the 60Hz signal generated by the power of the amplifier (see figure 3). In addition, when two electrodes have relatively different impedances, the differential amplifier becomes unbalanced and consequently becomes susceptible to amplify noise signals [6, 8, 9]. 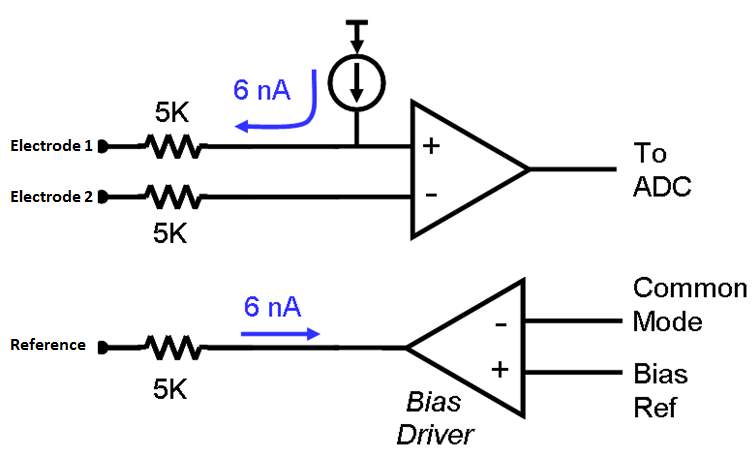 Figure 4 : Electrode electronic diagram [10]. The electrodes’ positioning depends on the type of evoked potential to be recorded. Their positions have been standardized in the International 10/20 System defined by "The International Federation in Encephalography and Clinical and Neurophysiology" (figure 4) [5, 6, 8, 9, 11]. In the case of VEP, two active electrodes are used to pick up the VEP signals. They are placed at the Cz and Oz positions which corresponds to chiasmal optic and occipital cortex respectively. The third electrode is used as reference (ground). It is fixed on the earlobe; either A1 or A2 positions, or at the Fz position where there is no neuronal activity. A conductive gel is used to ensure good conduction between the scalp and the electrodes [5, 6, 11].
 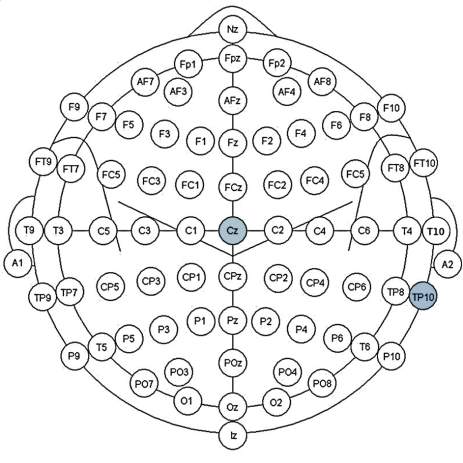 Figure 5: International 10/20 System for positioning EEG recording electrodes.
3.2.2. The amplification device
As for other electric signal of biological origin (biopotentials), it is necessary to amplify the recorded VEP signals considering their very low amplitudes (few microvolts) in order to allow their processing and analysis. For this reason, instrumentation amplifiers are required to increase the signal strength without introducing changes to its amplitude. Such devices are in the form of voltage differential amplifiers such as illustrated on figure 5 below [3]. The inputs of the amplifier are connected to the active electrodes and the ground is connected to the reference one. The VEP recording standards recommend that the signal should be amplified by 20,000 to 50,000 times, before it is processed [5, 6, 8, 9, 12]. The amplifier may also be provided with a band-pass filtering stage. Its low and high cutoff frequencies should vary between 0.5 to 3 Hz and between 100 and 300 Hz respectively in order to limit the spectrum of the recorded signal to the frequency band of the VEP. Furthermore, the used amplifiers shall be electrically insulated in accordance with international safety recommendations for recording medical equipment (IEC-601-1 LF specification) and shall have at least an input impedance of 100 MΩ. The frequency range should be set between 1Hz or less (low cutoff frequency) and 300Hz or more (high cutoff frequency) [5, 6, 8, 9].
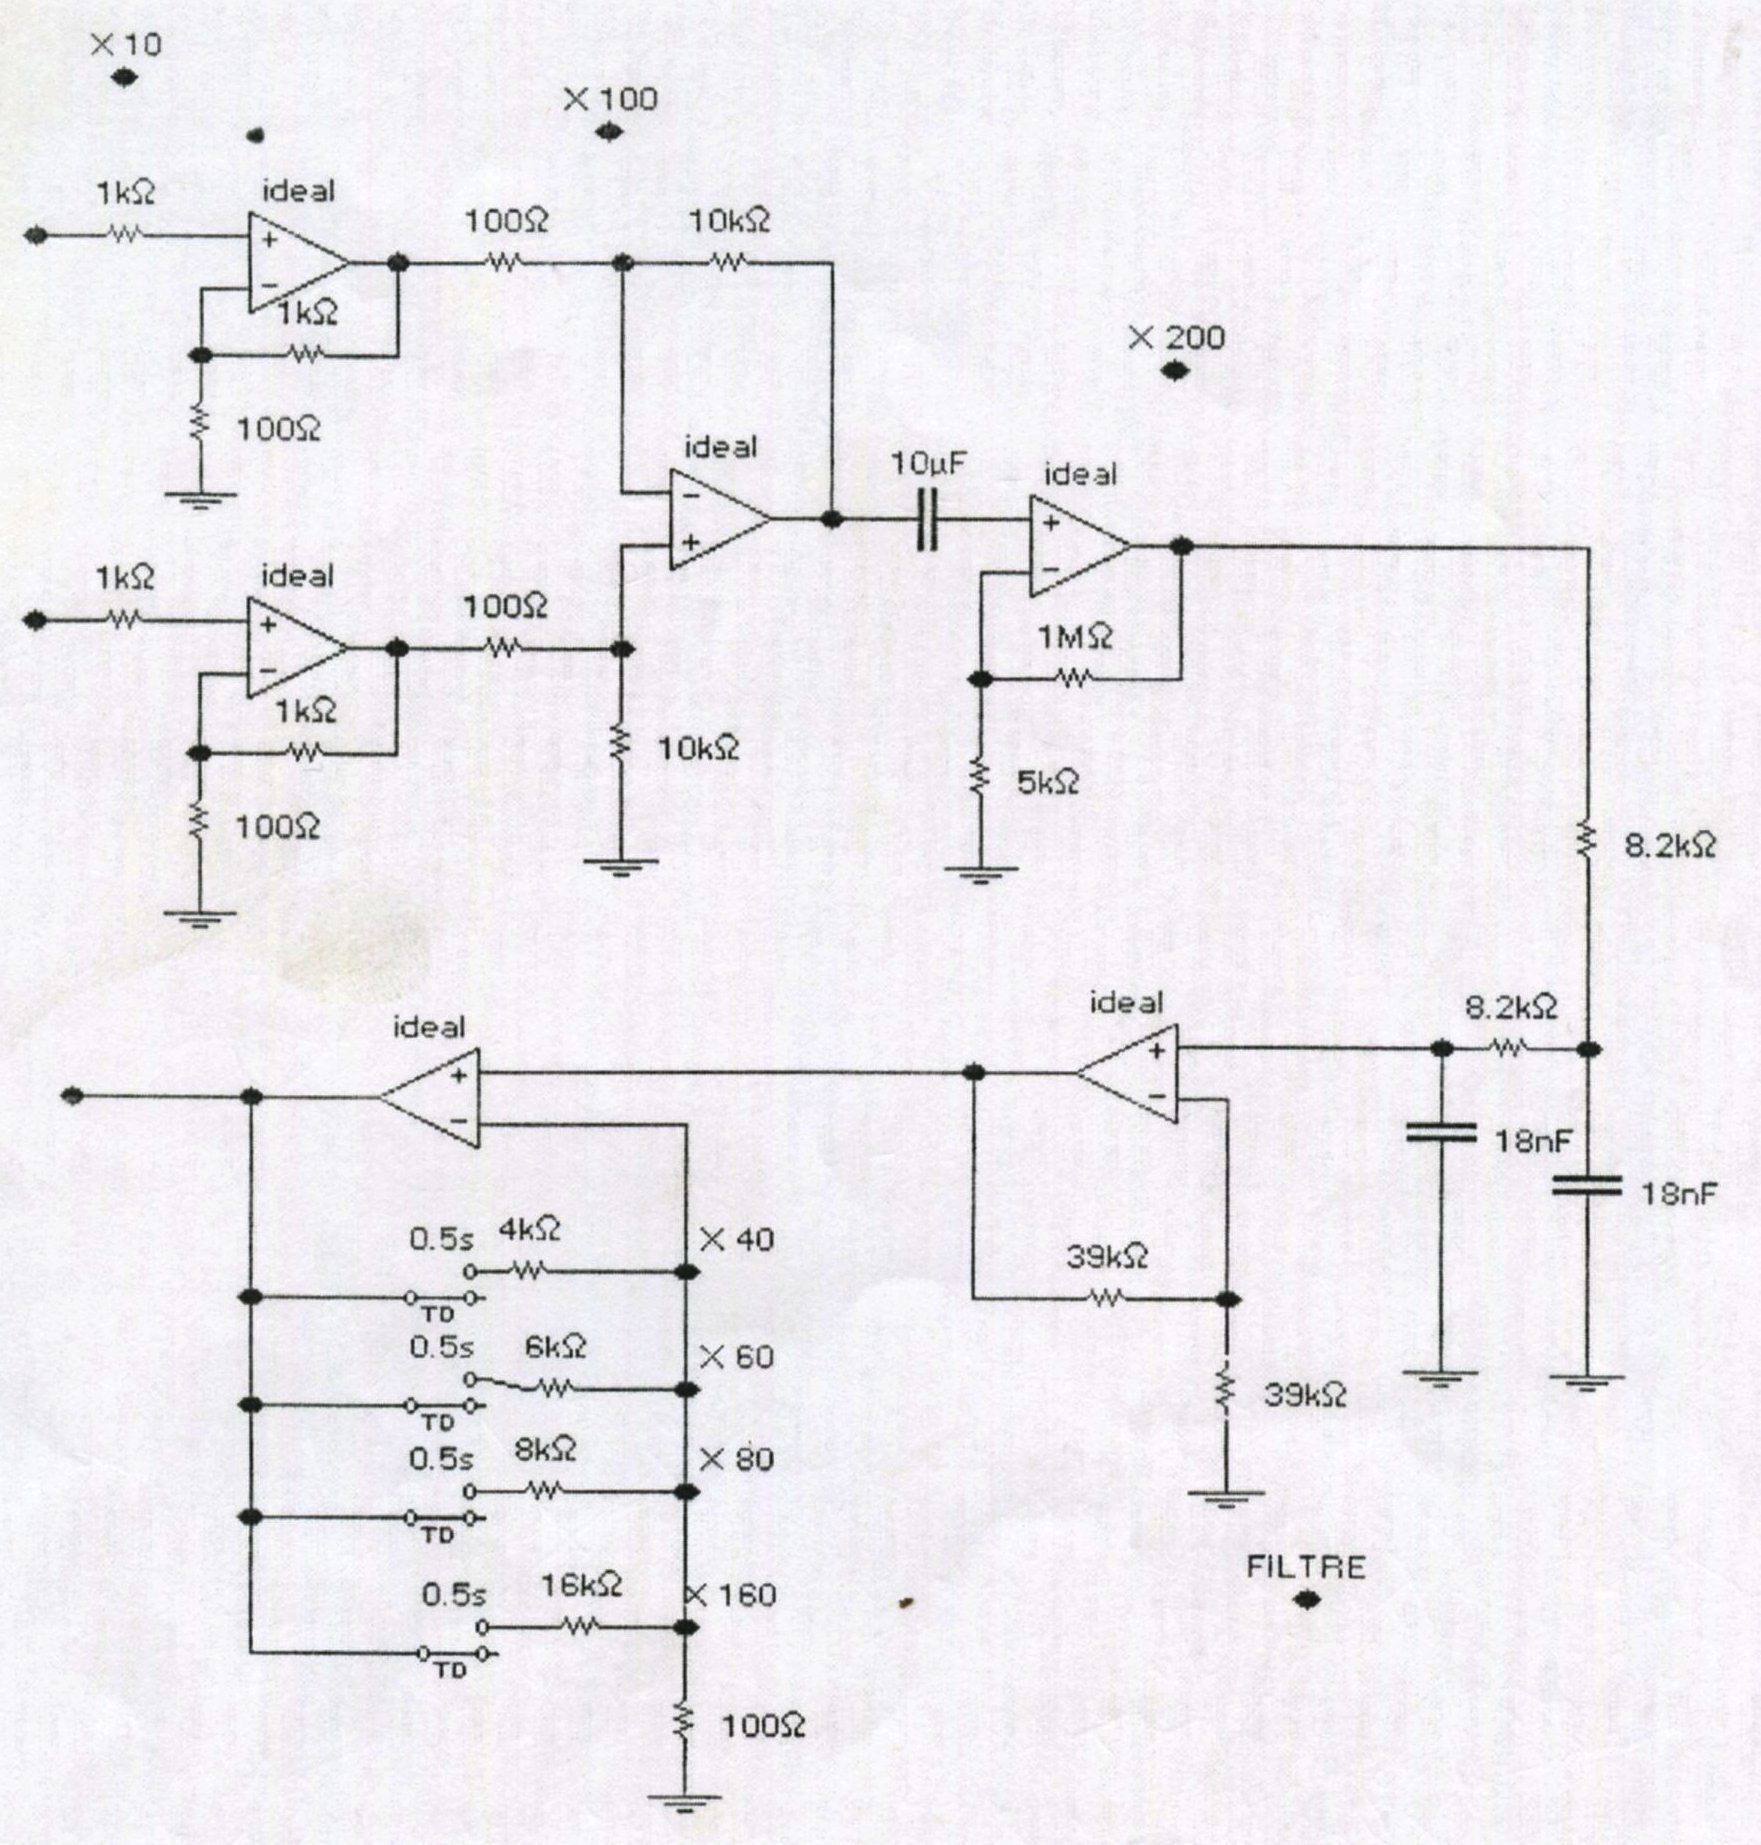 Figure 6: Basic VEP amplifier circuit diagram [3].
3.2.3. The analog-to-digital conversion card
The VEPs recorded on the patient's scalp are analog signals. Consequently, the data acquisition chain must include a high precision analog-digital conversion device in order to permit digital processing and analysis of the recorded data. The minimum sampling rate to use is 500 samples per second per channel with a minimum resolution of 12 bits. Signals exceeding ±50–100 µV in amplitude are considered as artifacts [5, 6, 8, 9].
3.3. VEP Software Module
This module consists of software that allows the control of the entire data acquisition chain. It allows carrying out several tasks of which the main ones are:
- The adjustment of data acquisition parameters;
- the choice of stimuli;
- Synchronization between the stimulation module and the data acquisition module;
- Processing and display of VEP signals;
- Data backup (patient data and test results).
In clinical practice, the VEP signal processing is achieved using the averaging technique. We will detail it more in Part II of this report [3, 4].
4. Visual Evoked Potential Test
Before carrying out the tests, the exam team must take certain measures regarding the adjustment of the stimulation parameters and the patient. Indeed, it is recommended that the stimulus, in the form of black and white checkerboard of 8x8 boxes of size 1°15’ each, must have a luminous intensity at least equal to 80cd.m-². The location of the stimulus projection monitor shall be such that the diameter of the visual field is between 8 ° and 20 ° in its narrowest dimension. In practice, this visual angle is generally chosen to be equal to 15°, which corresponds to a position of the screen situated 70 to 100 centimeters from the patient [1, 3, 4, 5, 6]. The patient must follow a few guidelines in order to be able to successfully complete his VEP test. He should not take medication that dilates the eyelids within 12 hours of the test and if he is wearing glasses, then he should wear them at the time of the test. It is also recommended that the hair be neither wetted nor that there is a presence of substances that can impair electrical conductivity on the scalp. During the VEP test, the patient is asked to be calm and relaxed and, mostly, to concentrate his vision on the projection screen of stimulations [1, 3, 4, 5, 6]. The test has duration of about thirty minutes, during which the patterns of the checkerboard change of contrast every half seconds. At each checker state change, the visual system of the patient is excited and produces a bioelectric response that can be detected and recorded via the electrodes [1, 2, 3, 4, 5, 6]. The test’s staff should then check that the VEP are recorded correctly.
5. Conclusion
In this part, we have presented visual evoked potentials that represent the response of the brain to the excitation of the visual field of human. Thus, we have indicated that these signals are composed of three main successive waves. The most important one, from the point of view of medical diagnosis, is the P100 wave which indicates the latency of the nervous system. If the latency is outside its normal range, this may be an indication of the presence of a possible cerebral pathology. We have then described briefly the different modules of the VEP data acquisition chain and gave an overview of the VEP test procedure. In the next part of the report, we will detail different filtering method used to extract the useful information contained in the VEP signals. Indeed, we will describe the averaging method, actually used in the clinical practice, and then we will tackle the adaptive filtering methods which we implemented and tested on our VEP set of data.
Part II: Linear and Nonlinear Filtering Methods
1. Introduction
As mentioned in the first part, single sweep VEP signals are very weak in amplitude and strongly masked by background noise. Thus, filtering them is very important in order to improve the signal to noise ratio. In this part, we describe two methods of filtering the VEP signal. The first one is the averaging technique which is used in clinical practice; whereas the second one is based on adaptive linear. We will illustrate the obtained results and compare the performance of these two methods.
2. Averaging technique
In clinical practice, the useful VEP signal is extracted using the averaging technique. It consists in calculating the average of several VEP single sweeps until a “clear” signal is obtained. This requires more than 100 visual stimulations. Indeed, the number of single VEP sweeps to be averaged depends on the signal to noise ratio. For that reason, the ISCEV VEP Standard [5, 6] recommends to set the minimum number of sweeps per average to 64 and to perform at least two averages to verify the reproducibility of the results. This will result in fatigue and discomfort of the patient and may affect its concentration during the test [3, 4]. The reliability of the Averaging Technique is doubtful considering that, theoretically, it provides an improvement of the signal-to-noise ratio directly related to number of averaged sweeps, based on the following assumptions [3, 4]:
- The recorded VEP signal is assumed to be purely deterministic and repetitive. This means that the signal is stationary and its statistical properties do not depend on the time;
- The background noise affecting VEP sweeps is an additive white Gaussian noise.
In theory, we assume that the recorded VEP xi(n)is composed by the useful part si(n)and the background noise νi(n): xin=sin+νi(n) (eq.1) The average signal corresponding to N recorded VEP signals can be defined by: x̂n=1N∑i=1Nxin (eq.2) Replacing the equation (eq.1) in equation (eq.2) , we find: x̂n=1N∑i=1Nsin+νi(n) (eq.3) Thus, x̂n=1N∑i=1Nsin+1N∑i=1Nνin (eq.4) Following the above second hypothesis in which it is assumed that νi(n)is a zero-mean additive noise (white Gaussian noise), the equation (eq.4) becomes: x̂n=1N∑i=1Nsin=ŝ(n) (eq.5) Finally, the average of N single VEP sweeps will converge to the desired VEP signal ŝn. Furthermore, the averaging technique will permit an enhancement of the signal-to-noise-ratio with a factor equal to the number of averaged VEP signals. In addition, the above assumptions are far from being valid in the case of VEP because the signal reflects a nonstationary character and the nature of the background noise is not very well known. Averaging thus may result in loss of information present in the signal, especially when the number of responses to be averaged increases [1, 3, 4]. For this reason, we propose a filtering method that is more reliable and which requires less time for the test. Indeed, adaptive methods have become an attractive tool that offers new signal processing capabilities to deal with nonstationary signals.
3. Principle of adaptive filtering
In order to overcome the shortcomings of the averaging method, variants of linear filtering techniques have been proposed as alternatives to this traditional method, standing only on assumption (2) above (additive noise). These techniques have enabled the VEP signal to be extracted on the basis of few recorded sweeps up to two-thirds the number of single VEP required by the averaging method. Thus, Davila C.E. et al. proposed a matched subspace filter is applied to the detection of multiharmonic VEP waves with unknown noise variance [13]. Orfanidis S.J. et al. proposed an adaptive noise canceller based on periodic pulse train as primary signal [3, 14]. Friman O. et al. proposed novel methods for detecting steady-state visual evoked potentials using multiple electroencephalogram (EEG) signals. Using short time segments, their methods provide high detection accuracy by finding combinations of electrode signals that cancel strong interference signals in the EEG data [15]. Other researchers proposed nonlinear filtering as alternative to the averaging technique. As example, we cite the paper of Hamzaoui E-M. et al. in which they developed a nonlinear filtering method based on a three layers perceptron neural network [4, 16]. Qiu W. et al. used Gaussian radial basis function neural network (RBFNN) for processing the reference input of adaptive signal enhancer which they applied to filter evoked potentials [17]. Another nonlinear method has been presented by Quiroga R. Q. et al. [18]. It consists of using wavelets decomposition for VEP signal denoising. Also, some research works have tackled the spectral analysis and modeling of the VEP signals in order to have new representations of these signals that may reveal pertinent information to be used for diagnosis of pathologies. In this way, Reagragui et al. [3] used an autoregressive model based on linear predictors and reflection coefficients for VEP parameterization; whereas, CUI J. et al. have applied Chirplet time-frequency representation to characterize VEP signals [19].
3.1. Adaptive filtering theory
A linear adaptive filter is a linear time variant system that uses two input signals called “primary” and “reference” signals. The figure 4 illustrates the schematic diagram of an adaptive filter; where x̂(n)represents the estimated signal and en=xn-x̂nis the estimation error. The reference signal y(n)is chosen so as to have a certain correlation with the primary signal x(n)[20, 21, 22]. 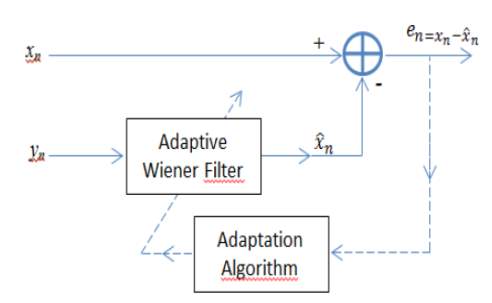 Figure 7: Adaptive filter block diagram [20]. The adaptive filtering technique consists in finding the "optimal" filter hoptn, called Wiener's solution, to obtain as output, the best estimate of the component of the primary signal xnwhich is correlated with the reference yn[3, 20]. Indeed, both xn and ynare supposed to be composed by a useful part snand two uncorrelated additive noise signals υ1nand υ2n: xn=sn+ϑ1nyn=sn+ϑ2n (eq.6) The output error of the filter is given by: en=xn-x̂n (eq.7) and the best estimated output x̂(n)of the filter of order N, is expressed as the convolution of the vectors h(n)and y(n): x̂(n)=∑i=0N-1hniy(n-i) (eq.8) This error is used as input of the feedback block in order to update the adaptive filter coefficients. This operation is still going on until the function hnconverges to Wiener’s optimal solution. This is expressed by reaching the minimum value of the mean square error E[en²]. This results in removing the uncorrelated parts between the two filter’s inputs [20, 21, 22]. The optimal coefficients of the filter h(n), initialized randomly, are adjusted using adaptation algorithms [20, 21, 22]. In order to choose one adaptation algorithm over another, several factors are considered. The most important are the accuracy of the estimation, the speed of convergence and the complexity of the computation (number of operations required at each step to update the filter’s coefficients) [20, 21, 22]. There are several algorithms that ensure the adaptation of the filter coefficients. Among these:
- The Least Mean Square Algorithm (LMS);
- The Normalized Least Mean Square Algorithm (NLMS);
- The Affine Projection Algorithm (APA);
- The Gradient Lattice Adaptation Algorithm;
- The Recursive Least Square Algorithm (RLS) [20, 22].
In this work, we have chosen to compare two optimization algorithms which are widely used in adaptive filtering: the Recursive Least Square Algorithm (RLS) and the Least Mean Square Algorithm (LMS) [20, 21, 22]. The LMS algorithm is very attractive for its simplicity. However, it provides a gradual, iterative, minimization of the mean square error (performance index). Thus, the optimal values of the adaptive filter coefficients are not computed instantaneously, but only after convergence [20, 21, 22]. The RLS algorithm which is based on the exact minimization of the least squares criteria, leads to the true solution at each time instant n [20, 21, 22]. The RLS algorithm has been proposed to be used in many applications (channel equalization, real-time system identification system, biomedical engineering,…) because they converge very fast. However, their computational complexity constitutes their main disadvantage [20].
3.2. RLS algorithm
Assuming that the statistical properties are unknown, we will not try to minimize MSE but a finite sum of squared error given by: ξ=∑k=0nxk-x̂(k)² (eq.9) When this cost function is minimized by using an impulse response h(n)associated with the least squared estimate x̂(n), is obtained [20, 21, 22]. The impulse response h(n) is thus a function of the available samples and not of a general statistical average. It is therefore adjusted at the presentation of each new sample. To limit the number of computations, we consider the recursive form [20, 21, 22].: hn+1=hn+e(n)k(n) (eq.10) where k(n) is the gain vector, called also the Kalman Gain [20, 21, 22]. It is given by: k(n)=Pny(n)λ+yT(n)P(n)y(n) (eq.11) Where,
- T denotes the vector transpose.
- P(n)denotes the inverse of the correlation matrix of the primary input signal which is calculated according to the following formula:
Ryy(n)=∑k=0nykyT(k) (eq.12)
- 0
Also, the RLS algorithm uses the following formula to update the inverse correlation matrix [20, 21, 22].: P(n+1)=λ-1Pn-λ-1k(n)yT(n)P(n) (eq.13) The RLS algorithm can be summarized as follows [20, 21, 22]:
- Initialize by setting:
Ryy0=1δIN ; δ is a positive number called the regularization factor. h0=0
- At each time sample n=1,2,…, do:
Compute the output of the filter : x̂(n)=hTn-1y(n) Calculate the error signal: en=xn-x̂n Compute the kalman gain: k(n)=Pny(n)λ+yT(n)P(n)y(n) Update the filter coefficients: hn+1=hn+e(n)k(n) Update the inverse correlation matrix: P(n+1)=λ-1Pn-λ-1k(n)yT(n)P(n)
3.3. LMS algorithm
Another adaptation technique based on gradient descent can also be implemented. In fact, the Least Mean Square (LMS) algorithm is often used in adaptive filtering systems [20, 21, 22]. They are used in various signal processing applications such as biomedical engineering, speech and audio processing, telecommunications,… The filter’s coefficients are updated according to the recursive formula: hn+1=hn+2μ eny(n) (eq.14) Where µ is the adaptation factor. This parameter is used to regulate the updating process and adjusts the coefficients’ fluctuations around their optimal values. Furthermore, the factor µ controls the filter. According to Widrow B., a too small value of μ will guarantee a slow convergence to the optimal impulse response. However, the filter will not be able to track sudden changes that may occur in the signal. Instead of that, if µ is very large the filter will not converge [20, 23]. The details of LMS algorithm are as follows [20, 21, 22, 23]:
- Initialize by setting:
h0=0
- At each time sample n=1,2,…, do:
Compute the output of the filter : x̂n=hTn-1yn Compute the error signal: en=xn-x̂n Update the filter coefficients: hn=hn-1+2 µ yne(n)
4. Obtained Results
All tests performed in this work, concern normal and pathological signals. Indeed, a database of 110 VEP single sweeps, corresponding to normal (50 VEP) and pathological (60 VEP) cases, will be used to test the implemented algorithms. The pathological dataset corresponds to a subject suffering from the multiple sclerosis disease. The VEP raw signals used in our experiment correspond to black and white checkerboard pattern reversal stimuli for which the contrast changes every 500 milliseconds. They were amplified by a gain of 106 and filtered using a [0.5; 300Hz] band-pass filter. They were sampled at a frequency of Fs=1kHz. To evaluate the efficiency of adaptive filtering technique, using both LMS and RLS adaptation algorithms, we compared the obtained results to the one of VEP signals filtered using the classical averaging method. Also, we compared the speed time and the mean value of the signal-to noise ratio for each adaptation algorithm in order to determine the most efficient adaptive filter.
4.1. Adaptive Filter’s settings
The difficulty encountered when using adaptive filters is the choice of the following three parameters:
- The order of the filter;
- The choice of the reference input;
- The adaptation algorithms’ parameters.
To overcome these difficulties, we have achieved several tests to well define some parameters and have searched in the bibliography for others. Indeed, the values of the adaptation factors µ and λ have been defined according to bibliographical studies. Thus, according to Regragui F. et al. [3], the best value of the adaption factor is µ=10-4. For the factor of forgetfulness λ, it is chosen to be 0.999 [4]. As the averaging method is used actually to extract VEP useful information, we felt it was a good idea to set the reference input as the VEP signal obtained by averaging all single sweeps corresponding to the normal subject. Finally, we plot the variation of the maximum value of the mean square error E[en²]according to the order of the filter in both cases LMS and RLS. This aims to define the best order of the implemented filter which corresponds to the minimum value of E[en²]. The obtained results show that the best order is M=21 (figure 5). 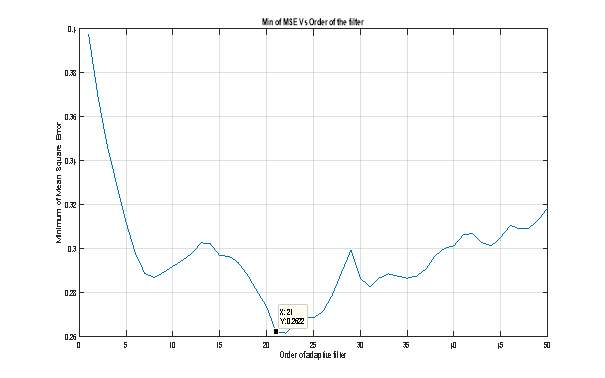 Figure 8 : Mean square error Vs Order of the adaptive filter. In the following section we will illustrate and comment the different results obtained while applying RLS and LMS adaptive filters to our set of VEP data. In order to perform the tests, we have used the DSP System Toolbox TM of the MATLAB ® R2015a software. Especially, we used the subroutines “dsp.LMSFilter system object” and “dsp.RLSFilter system object”. Both of them permit to construct and to apply adaptive filters to various types of data. The output of each subroutine results in a data structure that contains all information about the conceived filter such as its order, the adaptation method, initial values of all parameters,… We used them in the following program that allows us to process the VEP raw data and then to plot the gotten results which will be described the sections 4.2 and 4.3 bellow. %%%%%%%%%%%%%%%%%%%%%%%%%%%%%%%%%%%%%%%%%%% EECS UG Project - 2016 /17 % % Application of Linear Adaptive Filtering Methods for Visual Evoked % % Potentials Extraction and Analysis % % % % - Main program - % % % % Ismail El Mediouri % % i.elmediouri@se14.qmul.ac.uk % % % % Supervisor: Mr Luk Arnaut % %%%%%%%%%%%%%%%%%%%%%%%%%%%%%%%%%%%%%%%%%% % Init Matlab enviroment clear all; % Clear all variables in workspace clc; % Clear command window close all; % Close all figures % Load the VEP raw data load VEP_Normal % For pathological case, just change "VEP_Normal" by "VEP_Patho" % The variable VEPn should be replaced by VEPp for pathological case [L,C]=size(VEPn); % Size of the raw data % Init the adaptation algorithms' parameters d=mean(VEPn,2); % Reference input of the adaptive filter (desired signal) lambda=0.999; % Forgetting factor for RLS algorithm mu = 0.0001; % adaptation step for LMS algorithm for M=[1 10 15 25 49] for k=1:M xi=VEPn(:,k); % VEP raw signal tic % Start speed time counting % RLS Algorithm % Construct RLS filter hrls1 = dsp.RLSFilter(21,'Method', ... 'Conventional RLS' ,'ForgettingFactor', 0.9998); % Application of RLS filter [y1,e1] = step(hrls1, xi,d); toc % End speed time counting xf1(k,:)=y1; % Variable used to compute the average of filtred VEP snr1(k)=abs(snr(y1,e1)); % Compute the SNR % LMS Algorithm tic % Start speed time counting % Construct LMS filter hlms2 = dsp.LMSFilter('Length',21, ... 'Method','Normalized LMS',... 'AdaptInputPort',true, ... 'StepSizeSource','Input port', ... 'WeightsOutputPort',false); % Application of LMS filter [y2, err] = step(hlms2,xi,d,mu,1); toc % End speed time counting xf2(k,:)=y2; % Variable used to compute the average of filtred VEP snr2(k)=abs(snr(y2,err));% Compute the SNR end snr1=mean(snr1); % Mean value of SNR for RLS snr2=mean(snr2); % Mean value of SNR for LMS y1=mean(xf1);% Average of filtred VEP (RLS) y2=mean(xf2);% Average of filtred VEP (LMS) % Plotting results figure; plot(d/max(d)) % Averaged VEP hold on; plot(y1./max(y1),'r'); % RLS Filtered VEP hold on plot(y2./max(y2),'k'); % LMS Filtered VEP grid on; tl=['Fltering results of ' num2str(M), ' Normal VEPs']; title(tl) xlabel('Time (msec)') ylabel('Amplitude') legend('Averaged VEP', 'VEP-RLS', 'VEP-LMS'); end
4.2. Results obtained in normal case
The following figures 9, 10, and 11 illustrate the obtained results while processing 5, 10, and 49 VEP signals corresponding to a normal case. We can easily confirm, on visual reading of these figures, that the adaptive filtering method is more efficient than the averaging one. Also, the LMS algorithm permit to obtain a very smooth VEP signal compared to the one obtained by the RLS algorithm. In terms of speed convergence, the RLS algorithm was found to be very fast. However, it provides a very poor improvement of the signal-to-noise ratio as shown in the table 1. Table 1. Elapsed time and SNR mean value corresponding to normal case.
| Number of VEPs | Elapsed time RLS (Sec) | Mean value of SNR (dB) | Elapsed time LMS (Sec) | Mean value of SNR (dB) |
| 1 | 0.037089 | 1.4510 | 0.072339 | 4.1612 |
| 5 | 0.121992 | 2.0556 | 0.330341 | 4.5453 |
| 10 | 0.230967 | 3.4287 | 0.651309 | 5.7887 |
| 25 | 0.549598 | 4.1236 | 1.586431 | 5.3777 |
| 49 | 1.331302 | 4.7017 | 3.585921 | 5.5116 |
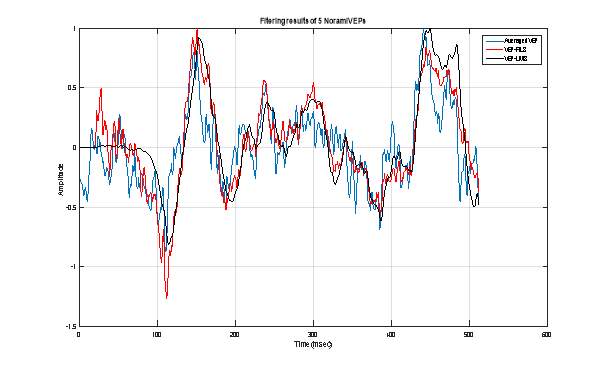 Figure 9 : Extraction of VEP signal using 5 normal VEP single sweeps: Averaging technique (Blue), RLS adaptive filtering (Red) and LMS adaptive filtering.
 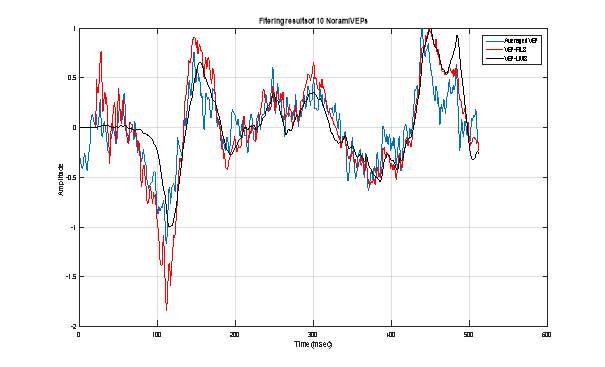 Figure 10 : Extraction of VEP signal using 10 normal VEP single sweeps: Averaging technique (Blue), RLS adaptive filtering (Red) and LMS adaptive filtering.
 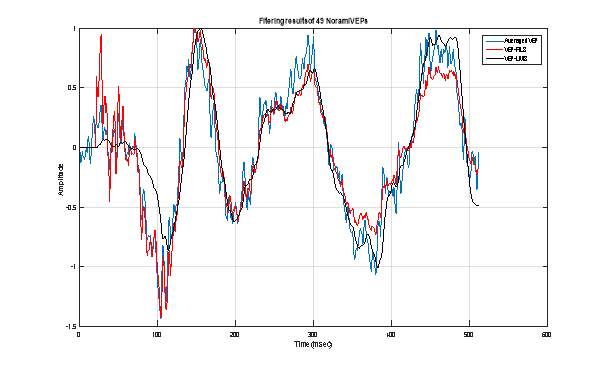 Figure 11 : Extraction of VEP signal using 49 normal VEP single sweeps: Averaging technique (Blue), RLS adaptive filtering (Red) and LMS adaptive filtering.
4.3. Results obtained in pathological case
As for the normal case, we plotted in the figures 12, 13 and 14 the obtained results while filtering 5, 10 and 49 VEP signals corresponding to a pathological case. We also summarized in table 2, the values of speed time of convergence and the mean value of the signal-to-noise ratio. We can attest that the adaptive filtering method allows achieving the best extraction of the useful VEP signal. In terms of SNR improvement, the LMS algorithm permits to obtain the best enhancement of this quantitative evaluation parameter. However, the convergence of LMS filter to its optimal Wiener solution still remains very slow comparing to the RLS one. Table 2. Elapsed time and SNR mean value corresponding to pathological case.
| Number of VEPs | Elapsed time RLS (Sec) | Mean value of SNR (dB) | Elapsed time LMS (Sec) | Mean value of SNR (dB) |
| 1 | 0.029756 | 9.1423 | 0.205499 | 35.2418 |
| 5 | 0.146096 | 7.4368 | 0.201001 | 35.4965 |
| 10 | 0.248237 | 6.3541 | 0.394975 | 37.3057 |
| 25 | 0.573078 | 5.3746 | 0.989825 | 41.7816 |
| 49 | 1.196058 | 5.3075 | 1.730240 | 41.8512 |
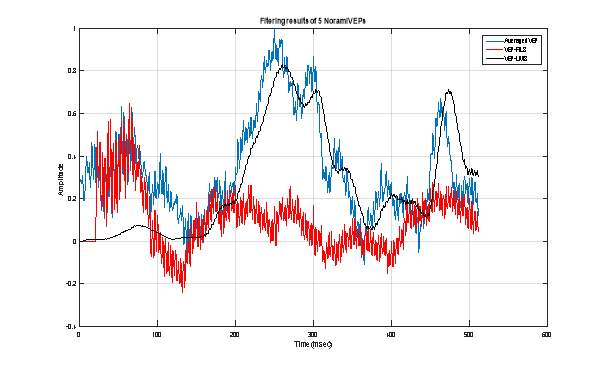 Figure 12 : Extraction of VEP signal using 5 pathological VEP single sweeps: Averaging technique (Blue), RLS adaptive filtering (Red) and LMS adaptive filtering.
 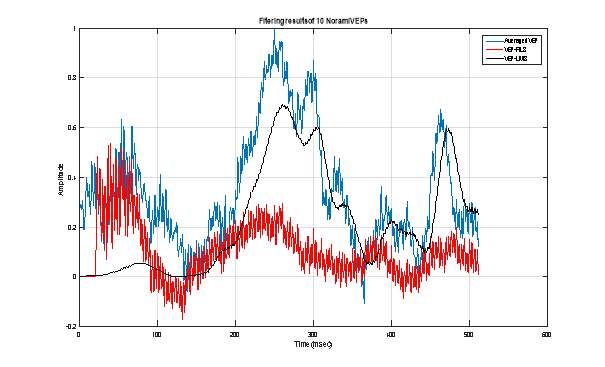 Figure 13 : Extraction of VEP signal using 10 pathological VEP single sweeps: Averaging technique (Blue), RLS adaptive filtering (Red) and LMS adaptive filtering.
 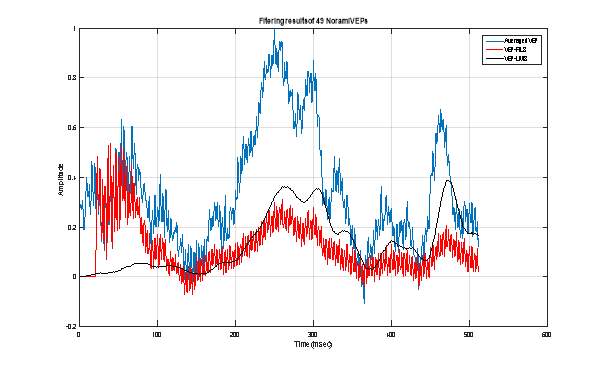 Figure 14 : Extraction of VEP signal using 49 pathological VEP single sweeps: Averaging technique (Blue), RLS adaptive filtering (Red) and LMS adaptive filtering.
6. Discussion
Traditionally, the clinical interpretation of VEP waveforms is based on the visual reading of their plots. The investigations focus on the latency components of the VEP signal which consists of the N70, P100 and N170 peaks. Especially, the time position of the first positive deflection (P100) is the most important for neurological diagnosis. This peak which occurs about 100 milliseconds following the stimulation, is reproducible among normal subjects and some patients having neurological disorders [3, 4]. The adaptive filtering method described and tested above, have permit to improve the visual quality of the VEP plot compared to the one obtained using the classical averaging method. These results were confirmed in both normal and pathological cases. Indeed, the gotten plots clearly show the peak P100 in the normal case just using a dozen of VEP raw signals. Furthermore, the LMS based adaptive filter shows good filtering performances rather than the RLS one. This is manifested by a good improvement of the mean value of the signal-to-noise ratio. The comparison of computation complexity of both LMS and RLS algorithms can be summarized as in table 3 below. Consequently, LMS based filtering method can be used for offline processing of VEP signals. Implementation of RLS algorithm on Field-Programmable Gate Array (FPGA) or Digital Signal Processor based cards can improve its convergence speed and will allows achieving real-time processing of VEP data. However, such implementation may be costly due to the RLS complexity. Table 3. Complexity comparison of LMS and RLS algorithms
| Algorithm | Speed time of convergence | Complexity | Stability |
| LMS | Slow | Simple | Stable |
| RLS | Fast | Complex | Stable |
General conclusion
the non-invasiveness and simplicity of visual evoked potentials recordings have encouraged their application for the diagnosis of many neurological diseases, including Multiple Screlosis, Alzheimer’s, … The neurologist can uses the information present in the VEP waveform to and thus avoid complementary tests that are often tedious and even be invasive. The purpose of this study is to conceive an adaptive filtering method that may improve the plot quality of the visual evoked potentials signals. Indeed, these signals are produced by the neural system following the stimulation of the human visual field. They are very weak and noisy signals. Consequently, powerful tools are needed to process them in order to highlight the information they contain. Indeed, we proposed in this work the application of the Least Mean Square and the Recursive Least Squares to a set of 100 recorded VEP raw signals corresponding to a normal (50 VEP) and a pathological patients. The obtained results show that both adaptive filters allow good improvement of the visual quality of the VEP plots rather than the conventional averaging technique used in hospitals. Also, the number of single VEP sweeps to be filtered has decreased consequently. Thus a dozen of VEP signals are needed to achieve the filtering task. This will reduce considerably the VEP test duration. Also, we have found that the LMS based algorithm, although it is slow, allows obtaining high values of the signal-to-noise ratio. However, the fast convergence performance of the RLS leads to use it in real-time processing of VEP signals. In forthcoming works, we suggest to develop nonlinear adaptive filtering methods to process the VEP signals. This is motivated by the fact that the nervous system is a nonlinear one.
References
- Chiappa K. H. (1983). Evoked Potentials in Clinical Medicine, Raven Press, NY, USA.
- Epstein C. M. (1983). Introduction to EEG and Evoked Potentials. Lippincott Williams & Wilkins.
- Regragui F. (1990). Extraction and Linear Prediction Modelling of the Visual Evoked Potential, PhD. Thesis, Rutgers University, USA.
- Hamzaoui E-M. (2011). Identification and characterization of visual evoked potentials sources for a better clinical use, Ph.D. Thesis, Mohammed V University, Faculty of Sciences, Rabat, Morocco.
- Odom J. V., Bach M., Barber C., Brigell M., Marmor M. F., Tormene A. P., Holder G. E. (2004). Visual evoked potentials standard (2004). Documenta ophthalmologica, 108(2), 115-123.
- Odom J. V., Bach M., Brigell M., Holder G. E., McCulloch D. L., Tormene A. P. (2010). ISCEV Standard for Clinical Visual Evoked Potentials (2009 Update), Documenta Ophthalmologica, 120(1), 111–119.
- Chaumon, M. (2008). Apprentissage implicite du contexte visuel et guidage de la perception: Expériences MEG et EEG intracrânien. PhD Thesis, Université Pierre et Marie Curie-Paris VI, Paris, France.
- Brigell M., Bach M., Barber C., Moskowitz A., Robson J. (2003). Guidelines for calibration of stimulus and recording parameters used in clinical electrophysiology of vision. Documenta Ophthalmologica, 107(1), 185–193.
- Acharya, J. N., Hani, A. J., Thirumala, P., Tsuchida, T. N. (2016). American Clinical Neurophysiology Society Guideline 3: A Proposal for Standard Montages to Be Used in Clinical EEG. The Neurodiagnostic Journal, 56(4), 253-260.
- EEG Hacker. OpenBCI: Measuring Electrode Impedance. Retrieved 18 April 2017, http://eeghacker.blogspot.com/2014/04/openbci-measuring-electrode-impedance.html
- Homan R. W., Herman J., Purdy P. (1987). Cerebral location of international 10–20 system electrode placement. Electroencephalography and clinical neurophysiology, 66(4), 376-382.
- Sakshat Virtual Labs (2011). To simulate Biopotential Amplifier. Retrieved 18 April 2017, http://coep.vlab.co.in/?sub=25&brch=78&sim=1135&cnt=1.
- Davila C. E., Srebro, R., Ghaleb I. A. (1998). Optimal detection of visual evoked potentials. IEEE Transactions on Biomedical Engineering, 45(6), 800-803.
- Orfanidis S. J., Regragui F., Micheli-Tzanakou E. (1987). Visual evoked potential extraction by Adaptive Filtering. Proc. of IEEE 19th Annual Conference of the Engineering in Medicine & Biology Society, 2, 968-969.
- Friman O., Volosyak I., Gräser A. (2007). Multiple Channel Detection of Steady-State Visual Evoked Potentials for Brain-Computer Interfaces. IEEE Transactions on Biomedical Engineering, 54(4), 742-750.
- Hamzaoui E-M., Regragui F., Himmi M. M., Mghari A. Visual Evoked Potentials' Non Linear Adaptive Filtering Based on Three Layers Perceptron. Applied Mathematical Sciences, Vol. 4, 2010, no. 56, 2759-2772.
- Qiu W., Fung K. S., Chan F. H., Lam F. K., Poon P. W., Hamernik R. P. (2002). Adaptive filtering of evoked potentials with radial-basis-function neural network prefilter. IEEE transactions on biomedical engineering, 49(3), 225-232.
- Quiroga R. Q. (2000). Obtaining single stimulus evoked potentials with wavelet denoising. Physica D: Nonlinear Phenomena, 145(3), 278-292.
- Cui J., Wong W., Mann S. (2005). Time-frequency analysis of visual evoked potentials using chirplet transform. Electronics Letters, 41(4), 217-218.
- Orfanidis S.J. (1985). Optimum Signal Processing. Macmillan Publishing Company. London.
- Haykin S. (1991). Adaptive Filter Theory. Englewood Cliffs, NJ: Prentice Hall.
- Sayed, A. H. (2003). Fundamentals of adaptive filtering. John Wiley & Sons.
- Widrow B., Stearns S. D. (1985). Adaptive Signal Processing. 1st Ed. Prentice-Hall.
Cite This Work
To export a reference to this article please select a referencing stye below:
Related Services
View allRelated Content
All TagsContent relating to: "Neurology"
Neurology is the specialist branch of medicine that deals with the treatment of disorders of the nervous system. This means that neurologists concern themselves with issues affecting the brain, the nerves, and the spinal cord.
Related Articles
DMCA / Removal Request
If you are the original writer of this dissertation and no longer wish to have your work published on the UKDiss.com website then please:


