How Well Do Engineered Aeration Systems Improve Water Quality in Drinking Water Supply Reservoirs?
Info: 15161 words (61 pages) Dissertation
Published: 11th Dec 2019
How well do engineered aeration systems improve water quality in drinking water supply reservoirs?
4.1. The importance of the issue
4.2. Manganese in drinking-water supply reservoirs
4.3. Algae in drinking-water supply reservoirs
4.4. Engineered aeration systems
5.1. Why are aeration systems necessary
5.2. Manganese in drinking water
5.3. How aeration systems work
5.5. Established design of aeration systems
5.6. ResMix (Scottish and Welsh Water)
5.7. Bubble plume systems (Bristol Water)
5.8. Do these systems actually work in-situ?
5.9. Developing an effective monitoring program
Figure 5.1: Diagram describing thermal stratification layers
Figure 5.3: ResMix aeration systems
Figure 6.1: Relationship between manganese levels in Barcraigs Reservoir and air temperature
Figure 6.2: Relationship between manganese levels and air temperature in Burncrooks Reservoir
Figure 6.3: Relationship between manganese levels and water temperature in Blagdon Lake
Figure 6.5: Relationship between manganese levels and water temperature in Chew Valley Lake
Figure 6.4: Relationship between manganese levels and water temperature in Cheddar Reservoir
Figure 6.6: Manganese levels in Pontsticill Reservoir
Figure 6.7: Manganese levels in Pontsticill Reservoir (2008-2015)
Figure 6.8: Relationship between manganese levels and air temperature in Pontsticill Reservoir
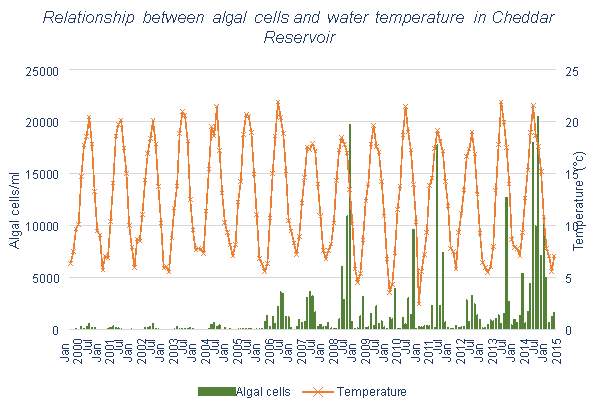
Figure 6.10: Relationship between algal cells and water temperature in Cheddar Reservoir
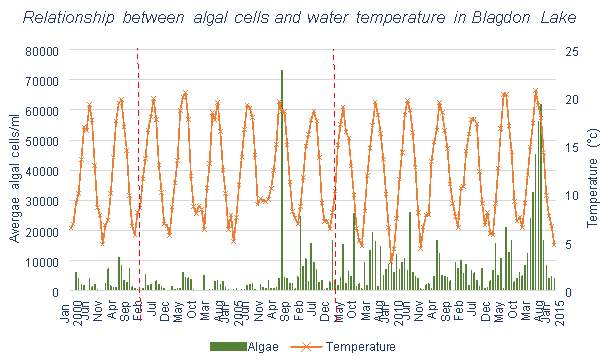
Figure 6.9: Relationship between algal cells and water temperature in Blagdon Lake
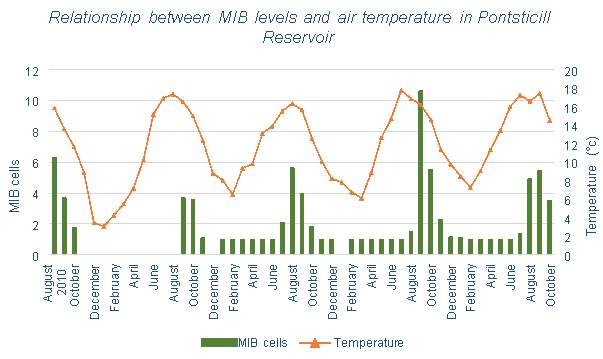
Figure 6.12: MIB levels in Pontsticill Reservoir
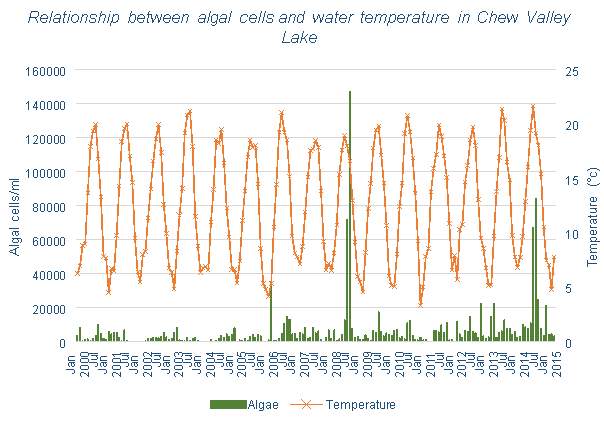
Figure 6.11: Relationship between algal cells and water temperature in Chew Valley Lake
Figure 6.13: Relationship between MIB levels and air temperature in Pontsticill Reservoir
Table 5.1: Examples of recommended levels for manganese in drinking water
Table 5.2: Description of Aeration Systems
Table ?: Comparison of aeration systems effect on algal blooms
Table 6.1: Mean, minimum and maximum levels of Mn and algae (Centre for Ecology and Hydrology, n.d.)
Table 6.2: Lake or Reservoir characteristics
Table 6.3: Percentage below UK guidelines for manganese
Table 6.4: Overall Mn percentage decrease
SOD Sediment Oxygen Demand
HOD Hypolimnetic Oxygen Demand
WOD Water-Column Oxygen Demand
Mn Manganese
WHO World Health Organisation
DO Dissolved Oxygen
P Phosphorus
THM Trihalomethane
Clean, safe drinking water should be readily available to everyone, meaning that providing it is an integral health and development issue. If more is invested in water supply and sanitation, adverse health effects caused by unclean drinking water should be reduced, which will in turn decrease health care spending on the adverse effects. In this regard, “Guidelines for Drinking-water Quality”, published by the World Health Organisation, aims to ensure drinking water safety, as well as outlining requirements and giving specific guideline values. In following these guidelines, drinking-water supply agencies are responsible for quality assurance and quality control. Therefore, if there are issues with the water quality, e.g. customer complaints are received and/ or the desired guideline values of certain elements or chemicals have not been met, they are responsible for complying with the guideline values and responding to any complaints.
Managers of water treatment plants must focus on a variety of concerns (need to cite GURNEY):
- Water quality.
- Financial budgets.
- Reduction in carbon output.
- Statutory regulations.
- Consumer expectations.
Partial or complete hypolimnetic anoxia due to depletion of dissolved oxygen in the lower waters of reservoirs occurs during summer stratification. This occurs due to decomposition of organic matter and a lack of exchange between the upper and lower waters. This causes many problems, one of which is the release of various reduced compounds, notably those of Mn (Liborussen et al., 2009), along with the release P and increased growth of cyanobacteria. Reduced compounds are compounds which have lost or donated an electron to another chemical species in a reduction-oxidation (redox) reaction. Water aeration systems are commonly and increasingly implemented in the UK to increase levels of dissolved oxygen and improve water quality in drinking water supply reservoirs. Almost all UK drinking water utilities use these systems in order to reduce their spending on water treatment, as well as reducing the number of customer complaints which lead to heavy fines. However, there are concerns about whether these systems are meeting performance expectations, as knowledge on how these systems affect the biogeochemistry within reservoirs is very limited.
Manganese (Mn) is one of the most abundant metals in the Earth’s crust, and naturally occurs in many surface water and groundwater sources, particularly in anaerobic or low oxidation conditions. This leads to problems relating to taste, odour, and colour, and can lead to staining of fixtures and laundry. The World Health Organisation (2011) gives a health based guideline value for Mn of 0.4mg/l, as adverse effects can come from high levels of Mn in drinking-water. However, a guideline value of 0.1mg/l is also given for aesthetic quality, if levels exceed this it would be inappropriate for use as drinking water. Mn cannot be removed by water treatment processes unless a more complex chemical oxidation step is included, so its presence causes particular problems in drinking water supply reservoirs (Sly, 1990).
Algal blooms are caused cyanobacteria, and are aesthetically displeasing, as well as being potentially hazardous and contributing to anoxic conditions. These usually develop in the summer months due to increased water temperature, sunlight access, and the formation of stratification (which favours cyanobacterial growth) (NSW Government 2016). They occur due to nutrients such as P reaching surface waters of lakes, causing rapid growth of algae. Cyanobacteria is a toxic species of algae which produces chemicals such as MIB, which has a major influence on drinking water quality due to the occurrence of biogenic tastes and odours (Izaguirre and Taylor, 2004). A provisional guideline value has been adopted by WHO of 1 μg/l for microcystin-LR (WHO 1998) which is a toxin produced by cyanobacteria. However insufficient data was available to derive a guideline value for other cyanotoxins (WHO, 1999)
This dissertation will investigate and assess the performance of engineered aeration systems, and discuss why these systems are needed. It will also explain the effects of manganese and algal blooms on drinking water supply reservoirs.
The objectives of this dissertation are:
- To investigate whether aeration systems work in-situ.
- To assess the effect of aeration systems on Mn levels using data from three different UK water utilities.
- To assess the effect of aeration systems on algal blooms using data from two different water utilities.
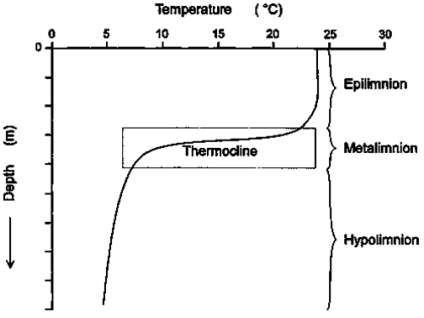
Engineered aeration systems aim to decrease the need for potentially harmful chemicals during water treatment, as well as decreasing the costs associated with water treatment. These systems should help to reduce the effects of thermal stratification in reservoirs. Thermal stratification commonly occurs in reservoirs due to the increase of temperatures in the summer months, this is illustrated in Figure 5.1 below. Distinct layers are formed, cutting off the lower layer of the lake from the atmosphere, meaning that it is cold, dark, relatively undisturbed, and excluded from a direct supply of oxygen (Lake Stratification and mixing). The epilimnion is the top of the lake, the metalimnion is the middle layer, and the hypolimnion is the bottom layer.
Figure 5.1: Diagram describing thermal stratification layers
Eutrophic lakes are those rich in nutrients, where an increase in biological production takes place due to excessive addition of silt, organic matter, and plant nutrients into the lake. This leads to increased growth of algae and weeds. Most notably, this also leads to increased contribution of organic matter to the hypolimnion, which leads to the depletion of dissolved oxygen (DO) (Cooke and Carlson, 1989; Bryant, 2011), resulting in anoxic conditions. This occurs because the oxygen contained in the hypolimnion is consumed by the organic matter at the bottom of the lake, and this oxygen cannot be replaced due to the lack of sunlight limiting the ability of algae and plants in the hypolimnion to produce oxygen by photosynthesis. The depletion of DO is worsened by the degradation of algae, which settles through the water column while decomposing aerobically (Gantzer et al. 2009). According to Hondzo et al. (2005), DO is one of the most critical environmental factors with respect to water quality.
In scientific terms, anoxic conditions lead to a change in redox potential (e.g. for manganese) due to the decomposition of organic debris using other terminal electron acceptors with lower available energy than oxygen (Madigan et al., 2003). This reduces Mn oxides and subsequently releases soluble, reduced species such as Mn2+ from the sediment (Gantzer et al., 2009), which contribute to water quality issues. Extended periods of anoxia will lead to more significant deterioration of water quality as these reduced species enter the hypolimnion (McGinnis and Little, 2002; Matthews and Effler, 2006a). Problems caused by the anoxic conditions are usually solved through changes in plant operations, amounts and timing of chemical additions, installation of advanced treatment practices, or plant redesign (Cooke and Carlson, 1989).
In more extreme weather conditions, winter stratification may occur. This is due to the surface waters experiencing cold temperatures, and the cooled waters sinking to the bottom of the lake due to the difference in density. As the surface waters cool even further, ice will form and float on the surface of the lake, cutting the lower levels of the lake off from the atmosphere (Illinois EPA, 1997). However, this is not as likely in the UK as summer stratification, as such low temperatures are unlikely to be reached for long enough.
Manganese (Mn) is not regarded as a toxic component of drinking water, but it is problematic for water treatment authorities (World Health Organisation, 1984). This is due to complex redox (reduction/oxidation) kinetics of Mn dictated by various constraints (such as the pH of the water), and the difficulty faced when removing Mn from drinking water by using conventional water treatment processes (AWWA, 1987), as a chemical oxidation step must be specifically included (Sly et al., 1990). Due to thermal stratification and low DO levels, Mn, along with iron (Fe) and other heavy metals, is increasingly released into the water column and concentrated into the hypolimnion. This is a problem for water utilities particularly if they siphon water from the bottom of their reservoir.
Mn and Fe are transition metals widespread in the environment, occurring in all rocks and soils (Krauskopf and Bird, 1995). Mn is also deposited into reservoirs via human activities (Ljung and Vahter, 2007). A surge in concentration of these elements in water supply bodies causes concerns for water authorities in the UK (Heal 2001). Higher concentrations of Mn and Fe will cause problems associated with taste, odour and colour when treated for potable use (Cooke and Carlson, 1989); for example, Mn oxide deposits will form in pipes, which when sloughed, results in poor quality water in drinking water distribution systems. This can cause a brown-black colour and undesirable taste (Sly et al., 1990). Sly (1987) conducted their own study and found that although the World Health Organisation (1996) and the Australian Drinking Water Guidelines (NH&MRC and ARMCANZ, 1996) give recommended concentrations of 0.1mg/l for manganese, consumer complaints increased in the Gold Coast City in Australia when the levels of manganese rose past 0.01mg/l.
Table 2.1: Examples of recommended levels for manganese in drinking water
| Mn concentration (mg/l) | Reference |
| 0.1 (aesthetic), 0.4 (health-based) | World Health Organisation (2011) |
| 0.1 (aesthetic), 0.5 (health-based) | Australian Water Resources Council (AWRC) (2011) |
| 0.05 | Environmental Protection Agency (EPA) USA (2004) |
| 0.05 | Hart (1974) (Sly et al., 1989) |
| 0.01-0.02 | Griffin (1960) (Sly et al., 1989) |
| 0.01 (<0.02) | Sly et al. (1989) |
| 0.1 | World Health Organisation (1983) |
| 0.05 | Drinking Water Inspectorate (DEFRA UK) (2010) |
According to Sly (1990) who conducted a study in the Gold Coast, Queensland, Australia, consumers close to the Molendinar water treatment plant, received dirty water immediately once Mn levels exceeded 0.02mg/l. Consumers at a greater distance from the Mudgeeraba water treatment plant, also in the Gold Coast, experienced a delay of a few days before receiving dirty water, and could tolerate a higher level of Mn at 0.4mg/l/. This study shows significant deposition of Mn occurred at 0.03mg/l, which is significantly lower than the guideline levels of 0.1 given by WHO and AWRC). Sly (1990) concluded in his study that levels of Mn should be given a guideline value of 0.01mg/l (<0.02mg/l) for minimum deposition, and even at this level chlorination is essential in avoiding microbial deposition on Mn. Sly also states that due to developments in water treatment technology, it should be possible to treat Mn out to much lower levels than it has been previously. Taking this into account, the guideline levels of Mn should be lowered by WHO and other organisations.
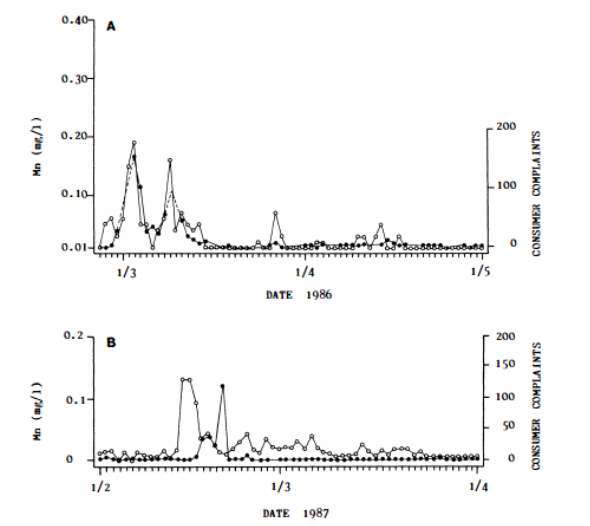
Figure 5.2 from Sly et al. (1989) compares the Mn concentration with the number of consumer complaints, and shows a clear correlation. High numbers of consumer complaints can be seen to occur when Mn levels exceed 0.05mg/l, and were not eliminated until levels remained below 0.02mg/l continuously. Levels of 0.02mg/l for 2-3 days, and 0.03mg/l for 1-2 days resulted in a small increase in consumer complaints. This implies that the organisations promoting a level
Figure 2.2: Relationship between manganese concentration (white dots) found in drinking water and the number of consumer complaints (black dots) received for two water distribution systems.A – Molendinar treatment plant, B – Mudgeeraba treatment plant (Sly et al. 1989).
of 0.1mg/l or higher are being too lenient and should consider lowering their recommended concentration if they are serious about reducing consumer complaints. Since April 1986, the Molendinar treatment plant has aimed to keep Mn levels below 0.01mg/l and problems associated with Mn-related dirty water have been eliminated.
Despite research showing its correlation with consumer complaints due to dirty water, the WHO has not enforced a lower limit for Mn concentration. In the UK, consumer complaints due to Mn levels cost utilities millions of pounds to address annually: for example, Welsh Water has recently spent £1.8 million, Thames Water £5 million, and Yorkshire Water £10 million (LEES PROPOSAL). If the water utilities hope to spend less money addressing these complaints, they will have to ensure a decrease in Mn levels.
Although possible, it is complex and costly to remove Mn from drinking-water supplies using conventional treatment processes, such as coagulation, flocculation, clarification and filtration. This would require increased levels of chemicals such as chlorine, which can also cause taste and odour problems as well as carcinogenic by-products (LEES PROPOSAL).
Low-quality water in drinking water supply reservoirs will present problems for water companies as the cost of water treatment will increase, and will perhaps not result in water of a high enough standard anyway. Aeration and mixing systems are useful in overcoming these water quality issues. Another option is to upgrade water treatment works, but this would involve considerable capital investment, and considering that managing manganese in the treatment process can be difficult, there has been increasing interest in improving raw source water quality (Gantzer et al., 2009).
Aeration aims to:
- increase and maintain DO levels in the hypolimnion and in the upper levels of the sediment (Moore, 2015)
- minimise the release of soluble chemical elements such as Mn and Fe from the sediment, which should reduce chemical demand during treatment processes
- control long-term eutrophication by reducing internal phosphorus (P) loading
- prevent formation of stratification which supports the formation of algal blooms and depletion of DO
- decrease the concentration of algae and limit its growth.
These systems introduce air or oxygen and mixing into the water column, which in principle should replenish the DO levels in the lower waters. Gas bubbles in contact with water facilitate transfer of oxygen and other soluble gases (Singleton and Little, 2006). Aeration systems mix the top and bottom waters of the reservoir, aiming to mix the algae throughout the water column, meaning that not only the buoyant species of algae will be able to grow in the epilimnion.
The addition of oxygen (or air providing oxygen) should lead to the oxidation of the Mn, creating Mn oxide, an insoluble compound, as well as decreasing the release of Mn from the sediment of the lake or reservoir. Once this reaction has taken place and a solid is formed, this solid is free to sink to the bed of the reservoir and settle, meaning it should less able to affect the quality of the water. An increase in dissolved oxygen should also help to prevent the anaerobic release of P, which is a key driver of algal growth, see section 5.4 below.
An algal bloom is the rapid excessive growth of algae which can be visually conspicuous, potentially hazardous, aesthetically unpleasant, and can contribute to the development of anoxic conditions. Cyanobacteria, a more toxic species of algae often referred to as blue-green algae, is a buoyant species which tends to be more abundant in stratified conditions (Auckland Council, 2013).
Cyanobacteria produces chemicals such as MIB, which has a major influence on drinking water quality due to the occurrence of biogenic tastes and odours (Izaguirre and Taylor, 2004). A provisional guideline value has been adopted by WHO of 1 μg/l for microcystin-LR (WHO 1998) which is a toxin produced by cyanobacteria. However insufficient data was available to derive a guideline value for other cyanotoxins (WHO, 1999)
According to Lorenzen and Fast (1977), aeration can affect the algal biomass, species composition, and rates of production of algae. However, the effects of aeration on algae are somewhat unpredictable. Lake Notes, published by the Illinois Environmental Protection Agency, suggest that aeration systems aim to decrease algal blooms through these means:
- Algal cells will be mixed deeper into the lake, reducing their ability to grow and multiply by limiting their time in sunlight.
- Less harmful species of algae may be favoured due to their tendency to sink quickly and need for mixing currents to remain suspended in the hypolimnion with access to sunlight and DO.
- The effects of changed levels of DO will affect the chemistry of the lake. This may lead to an increase in less harmful algae and a decrease in the noxious blue-green algae. While this may not decrease the total algal cells in the lake, it will decrease the proportion of noxious algae.
- Zooplankton in the epilimnion will be mixed down with the deeper areas of the lake, increasing their chances of survival from sight-feeding fish. If the levels of zooplankton increase, consumption of algae due to the zooplankton will also increase, so the overall level of algae will reduce.
- When DO levels are increased in the hypolimnion, P release from the sediment will be inhibited. This is beneficial because P in the surface waters of lakes is known to stimulate the multiplication of algal cells. Algal blooms due to P tend to be seen in the autumn months, when the nutrient-rich waters at the bottom of the lake are brought to the surface and the growth of algae is encouraged by sunlight. When anoxic conditions occur, P becomes more soluble and is released from the sediment, in the same way that occurs for manganese, as noted at 5.3 above.
- Finally, if the stratification of lakes is prevented, algal growth should be reduced.
The artificial circulation caused by aeration will create a hostile environment, inhibiting the growth of algae in the lake (Chipofya and Matapa, 2003). Chipofya and Matapa investigated the destratification using compressed air of Mudi reservoir in Blantyre, Malawi. The surface waters of this reservoir are enriched with nutrients due to run-off from agricultural land, which promotes growth of algal blooms, creating a bad taste and odour in the water, and producing toxins. A compressed air destratification system (CADS) was installed in Mudi reservoir, whereby air is artificially circulated in the reservoir through a perforated pipe connected to an electrically driven compressor. This method of aeration induces artificial circulation of the water, aiming to create a hostile environment that inhibits algal growth. This study analysed data on the parameters of algal counts and determination of species, DO profiles, and temperature profiles.
Depletion of DO in the hypolimnion is worsened by the degradation of algae which settles in the water column. This debris undergoes aerobic decomposition in the presence of DO, contributing to water column oxygen demand (Gantzer et al. 2009). Incompletely oxidised waste then accumulates on the bottom of the reservoir with the sediment and contributes to sediment oxygen demand (Matthews and Effler, 2006b; Beutel et al., 2007). Overall, hypolimnetic oxygen demand (HOD) will be increased by these processes. By reducing the growth of algae, overall HOD should be reduced, so anoxic conditions should be less likely to occur.
The use of aeration in order to reduce levels of algae in lakes is most suited to deeper lakes, as the methods of its reduction rely of having the deeper, darker waters which have limited sunlight. This means that shallow lakes will not see these positive effects. This also applies to P and its relationship with algae. In shallow lakes, the levels of phosphorus will not come from the sediments in the hypolimnetic region of the lake. In this case, the phosphorus will come from external sources (e.g. watershed runoff, the atmosphere, waterfowl, septic systems), none of which will be affected by aeration. (Lake Notes)
Aeration systems can be split into two different categories (Chowdhury et al., 2013):
- Destratification systems, which mix the water column completely.
- Hypolimnetic systems, which keep thermal stratification intact.
There are many different types of engineered aeration system, including the bubble plume and the surface mixer. These are summarised in Table 5.2 below.
A key first element in hypolimnetic aeration is to define the hypolimnetic oxygen demand that will need to be satisfied (Moore, 2015). Hypolimnetic aeration systems have been historically undersized. This is due to the magnitude of the oxygen demand being underestimated in the design process.
Design engineers have relied on DO field data to estimate the HOD when designing the aeration system which will be installed into a given lake (Lorenzen and Fast 1977, Ashley et al. 1987). However, this design method appears to be inadequate as many aeration systems fail to substantially increase DO content in the hypolimnion (Smith et al. 1975, Taggart and Mcqueen 1981, Ashley 1983, Soltero et al. 1994).
Table 2.2: Description of Aeration Systems
| System type | Description |
| Air Injection systems – bubble plumes | Used by Bristol Water, in the UK. This system injects air (or oxygen) into the lake, creating a gas/water mixture which rises and gains momentum (Singleton and Little, 2006). This induces circulation and mixing throughout the water column, distributing DO throughout the lake (Gantzer et al., 2009). |
| Hypolimnetic Air Injection systems – bubble plumes | These systems are similar to the non-hypolimnetic air injection systems. However they aim to keep thermal stratification intact, rather than creating convection throughout the entire water column. Some lakes will require the cold lower layer of water to remain, as the destruction of stratification could adversely affect the ecosystem within the lake. A key disadvantage of hypolimnetic systems is that the supply of oxygen is relatively slow due to the small surface area available in the aeration apparatus. |
| Surface Mixer – artificial destratification | This system draws surface waters into the mixer and pushes it downwards. This causes the surface waters to mix with the bottom waters and initiates a complete cell convection within the reservoir. This aims to prevent or limit the development of thermal stratification, and works best in nutrient-rich lakes, where nutrient control is not feasible (Moore, 2015). |
| Surface Spray systems | Consists of a float supporting an electric-motor-driven impeller, which pulls water up in a fountain like spray. Reaeration can then occur in the atmosphere to the water affected by this process. (Lake notes) |
| Impeller-Aspirator systems | A system floating on the lakes surface which involves a motor-driven impeller drawing air down a shaft and propelling this water (along with air bubbles) at an angle downwards into the lake. |
| Pump-and-cascade systems | These consist of large pumps moving lake water to the top of a ramp like chute containing devices used to retain the flow of water. This water will then cascade down the ramp and return to the lake to a point located as far as possible from the water inlet. |
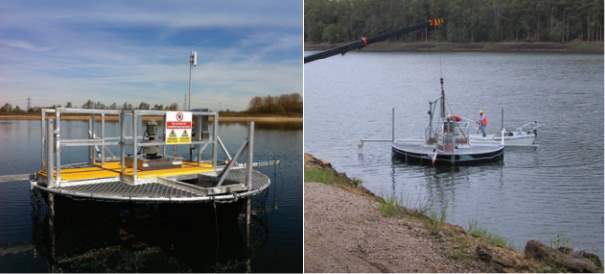 WEARS Australia have designed the ResMix system (shown in Figure 5.3) – a floating axial flow impeller system that skims large volumes of water from the surface and pushes it down to break up the layers caused by thermal stratification. It consists of a 5m diameter axial flow pump, moving water through an optional flexible draft tube from the surface through the metalimnion to the hypolimnion (Gurney Environmental, n.d.).
Figure 2.3: ResMix aeration systems
It is claimed to:
- be cost effective
- be simple to install, while not impacting the structural integrity of the reservoir
- use approximately one tenth of the power that conventional systems use
- begin to improve water quality within days
- oxidise metals such as Mn
- minimise algal blooms
- prevent autumn turnover
- have prevented algal blooms due to cyanobacteria in reservoirs using the system.
These air injection systems are one of the most common methods of destratification in reservoirs. There are two distinct methods of delivering air through to the bottom of the reservoir both of which are utilised by Bristol Water.
Chew Valley and Cheddar Reservoir:
A compressor on the shore delivers air through lines connected to perforated pipes.
Blagdon Lake:
Instead of perforated pipes, the air is delivered to simple diffusers called Aquaerators.
The air bubbles delivered throughout the lakes will rise, causing convection in the reservoir by bringing the cold water from the hypolimnion up to the surface waters. This will also lead to an increase in dissolved oxygen due to the addition of air to the water column.
The effects of aeration systems on lakes and reservoirs are not fully understood, meaning they are inefficiently managed and they are not always used to their full potential. The effectiveness of aeration appears to depend on the size of the reservoir and the extent of aeration used (Perks, 2006).
There have been negative effects known to happen due to aeration; mixing has been known to increase HOD during system operation, which will accelerate the depletion of oxygen. Plume models may be used to predict the rate of oxygen addition (Gantzer et al., 2009). Three such studies are listed at Table 5.3 below.
| Study | Findings |
| Ashley, 1981 | HOD was 10 times higher in an aerated hypolimnion than in a non-aerated hypolimnion. |
| Soltero et al, 1994 | HOD was approximately double pre-aeration demand in Medical Lake, Washington. |
| Lorenzen and Fast, 1977; Moore et al., 1996 | HOD was observed to increase three to four times during aeration. |
Also, an increase in SOD (Moore, 2003; Beutel et al., 2007), and an increase in WOD (Ashley, 1983) can lead to “Induced oxygen demand”, which is the increased oxygen consumption resulting from hypolimnetic aeration or oxygenation (Beutel, 2003). Increases in mixing due to aeration can increase sediment resuspension and DO consumption within the water column and at the sediment surface. This can increase the release of Mn from the sediment into the source water (Bryant, L., (pers.comm.) 23/03/2017).
It is uncertain how these systems will affect the physical and geochemical processes in reservoirs, as they frequently do not reach performance expectations. Large amounts of capital are invested into installing and maintaining these systems all over the UK, but they are inadequately assessed once installed (Bryant, L., (pers.comm.) 23/03/2017).
Published research on source water control of Mn is fairly limited to artificial destratification (Burns, 1998, Zaw and Chiswell, 1999, Ismail et al., 2002, Chipofya and Matapa, 2003, Grochowska and Gawronska, 2004), and laboratory experiments (Beutel et al., 2007). In addition, conflicting results have been found with regards to the behaviour of Mn and oxic conditions near the sediment water interface, (Beutel et al. (2007) has found that increased levels of dissolved oxygen at the sediment water interface (SWI) could decrease accumulation of Mn, while Pakhomova et al. (2007) has found that that Mn fluxes from sediments were independent of oxygen conditions. Most reports on the effects of oxygenation on water quality are based on single-lake/reservoir investigations, rather than reviewing multiple lakes/reservoirs (Beutel and Horne, 1999). This shows a need for exploring further research on controlling Mn in source water.
Some limitations of aeration systems include that the whole sediment surface area is not necessarily affected by aeration/oxygenation systems (Moore et al., 1996). Also, too much oxygen in the water can lead to supersaturation, which will cause its own variety of problems. Supersaturated water can cause corrosion and sedimentation problems, and air binding occurs when excess oxygen comes out of a solution in the filter, resulting in air bubbles which harm both the filtration and backwash process. Aeration can actually promote the growth of algae and can clog filters (Chowdhury et al. 2014).
The effect of aeration on levels of algae remains uncertain, as shown by the results studies listed at Table ? below.
Table 2.4: Comparison of aeration systems effect on algal blooms
| Study | Results |
| Visser et al, 1996 | Artificial mixing in Lake Nieuwe, The Netherlands, which has a mean depth of 18m, has had success preventing cyanobacterial blooms. |
| Hudnell et al, 2010 | Solar powered circulation has been implemented for cyanobacteria control in many lakes in the USA and Canada. Case studies of three lakes (mean depths 3m to 7.6m) indicated that the solar powered circulation was able to strongly suppress cyanobacterial blooms, although the authors also reported that results were not achieved in other shallower water bodies. |
| Haynes (1971) | Found that total aeration/destratification destroyed blue-green algae scums by circulating the cells throughout the water, even though there was little effect on the total biomass. |
| Maleug et al. (1971) | Noted a decrease in the total standing crop of blue-green algae during total aeration. |
| Robinsol, Irwin, and Symons (1969), Haynes (1971), Hooper, Ball and Tanner, 1952) | Increased numbers of blue-green algae have been observed during several aeration studies. |
| Ridley (1971) | Found that the density of blue-green algae increased during partial destratification. |
The cost of purchasing and installing these systems is approximately £1.5 million (depending on the type and size of the system), and thousands of pounds per year will all be spent on the costs of energy needed to be used for operation and in-plant treatment. This is a large amount of money to be spending on something that is not working to the degree that was expected. There has been minimal research on exactly how aeration systems influence the aquatic ecosystem as a whole and resultant water quality. It is imperative that this research area is highlighted within the UK to support sustainable water supplies and to help further establish the UK as a global leader in water quality research (Bryant, L., (pers.comm.) 23/03/2017).
Perks (2006) has outlined the importance for water utilities to develop a monitoring program in order to understand the changes to the reservoirs profile characteristics throughout the duration of the year. The level of data collection required to achieve the analysis of results needed should be decided based on available resources, funding, and level of training required.
Central Highlands Water (CHW), in Victoria, Australia, has developed a programme for this, which involves field staff collecting and analysing important reservoir profile data on a routine basis to help improve reservoir management (Perks, 2006). Some of the key features include:
- Acquiring an appropriate DO and temperature sensor. Features included should include repeatability of results, ease of use and calibration, durability, hand-held unit, lengthy cable, water resistance, ability to log data, and adequate technical support for staff training and repairs.
- Considering availability of resources such as boating equipment, trailers, vehicles, safety equipment, level of staff knowledge and training.
- Allocating designated days for field parties to undertake reservoir profiling.
- Identification of specific location within reservoirs for monitoring.
- Commencing with monthly monitoring to identify seasonal trends in reservoir profile characteristics.
- Adjusting monitoring interval to facilitate more detailed information.
- Obtaining readings at depth intervals of 1 metre within the profile of the reservoir.
- Developing and maintaining adequate computer files to easily store and analyse monitoring data, and training field staff to use the files with skill and confidence.
- Developing a reporting system to ensure that any abnormalities, trends or changes in reservoir profile are quickly reported to the coordinator.
Failure to monitor and control reservoir stratification can pose serious risks to water authorities. This monitoring program is a simple measure to take to properly manage their reservoirs (Perks, 2006)
Scottish Water, in the UK, has provided data from two different reservoirs, Barcraigs Reservoir and Burncrooks Reservoir between 2005 and 2016. Average Mn levels for each month over the time period of data collection has been provided. In order to compare these Mn levels to another parameter, the monthly average air temperature of Paisley (a town in close proximity to each lake) has been established from Met Office data for the purposes of this dissertation.
Bristol Water, again in the UK, has provided data for Blagdon Lake, Cheddar Reservoir, and Chew Valley Lake between 2000 and 2014, including Mn level, algal cell count, and water temperature (along with aluminium, arsenic and iron levels, colour, hardness, pH, TOC and turbidity, which were not discussed in this dissertation).
Welsh Water, also in the UK, provided data for Pontsticill Reservoir between 2000 and 2015. Mn and MIB levels were given, along with temperature in the area (also including colour and turbidity, which were not discussed in this dissertation). MIB level data was limited to 2010-2014, and temperature data was limited to 2002-2014.
The data used in this dissertation has been collected by the water utilities in order to monitor water quality and the effects of aeration. Weekly or biweekly water samples received by the water treatment works for each reservoir have been tested and then an average for each month calculated. This allowed the average Mn concentration (μg/l) and temperature (°c) for each month to be plotted on a graph to give a clear idea of the seasonal fluctuations, and whether the concentration of Mn had been affected by the aeration systems. This also gives a clear idea of how close the manganese levels are to falling below the drinking water guideline amounts. Bristol Water has also provided an algal cell count for its reservoirs, for which monthly averages have been calculated and these plotted on graphs compared with temperature. Welsh Water have provided MIB concentration, which is a toxic component cause by the presence of cyanobacteria, a species of algae. The water samples analysed have been taken after the water has been siphoned from the reservoir, before it is treated.
Reservoir characteristics including mean depth, surface area, catchment area and maximum depth (where available) have been included in this study as the physical characteristics can impact the effects of aeration.
Calculations have been undertaken to represent the effects of aeration on Mn. For example the overall percentage decrease after the installation of aeration equipment, this has been done using the average level of Mn over the time period both before installation and after installation. From this a percentage change was calculated, allowing a general idea of increase or decrease to be clear. Mean, minimum and maximum values for both Mn and algae have been calculating, showing which reservoirs are more nutrient-rich than others, and allowing simple comparisons to be made between reservoirs. The percentage of months whose average Mn level has remained below the UK limit has been calculated, as this gives a clear depiction of the need for water treatment works to remove Mn from the water.
In Barcraigs Reservoir (Scottish Water), the ResMix system was installed in June 2012 and is operated seasonally. In Burncrooks Reservoir (Scottish Water), the system was installed in February 2009 and operated seasonally, but the decision was made in December 2013 to operate the system full-time. In Pontsticill Reservoir (Welsh Water), the system was installed in October 2014 for seasonal operation. Seasonal use would involve operation from approximately April until October.
An initial five Aquaerators were installed into Blagdon Lake between 2001 and 2002 at distances of 200m, 250m, 400m, 600m and 850m from the Outlet Tower in the deepest areas. A further two systems were installed in June 2008 due to high Mn levels being recorded, all of the systems in Blagdon Lake will be operated seasonally. Cheddar Reservoir and Chew Valley Lake each contain 5 aeration lines, and it is assumed that the aeration lines were installed prior to 2000 and operated seasonally as details have not been provided. Seasonal operation refers to use between the months of April and October.
- Overview
Table 3.1 and 3.2 below give basic information about each reservoir investigated in this dissertation. Table 3.1 gives the mean, minimum and maximum Mn levels and algal counts for the reservoirs. Blagdon Lake has the highest mean and maximum Mn level, while Cheddar Reservoir significantly has the lowest. Whereas Chew Valley Lake has the highest mean, minimum and maximum number of algal cells/ml. Algal data was not provided from Scottish Water, meaning that Barcraigs and Burncrooks Reservoirs will not be included in the algae section of this dissertation. While the Bristol Water reservoirs have provided data showing the number of algal cells/ml in the water samples tested, Welsh Water have provided measurements of MIB in the water. MIB, also known as 2-Methylisoborneol, is produced by blue-green algae and will cause taste and odour issues if present in drinking water. This means that the algal data from Bristol and Welsh Water cannot be compared. However the data are still of value in so far as the indicate trends over time and, where applicable, the effect of installing engineered aeration systems.
Table 3.1: Mean, minimum and maximum levels of Mn and algae
| Mn | Barcraigs
2005-16 |
Burncrooks
2005-16 |
Blagdon
2000-15 |
Cheddar
2000-15 |
Chew Valley
2000-15 |
Pontsticill
2000-15 |
| Mean | 54.09 | 56.80 | 91.65 | 7.48 | 86.39 | 33.21 |
| Min. | 9.03 | 4.70 | 5.85 | 1.48 | 9.74 | 0.26 |
| Max. | 714.85 | 718.55 | 1,259.00 | 55.90 | 383.00 | 1,155.00 |
| Algae | 2000-15 | 2000-15 | 2000-15 | 2010-15 | ||
| Mean | – | – | 6,281.21 | 1,480.37 | 6,675.35 | 2.57 |
| Min. | – | – | 13.00 | 11.60 | 33.25 | 1.00 |
| Max. | – | – | 73,182 | 20,497 | 147,199 | 10.62 |
Table 3.2 gives some basic characteristics of the reservoirs, and will allow further analysis to be made based on size, depth, and catchment area. Chew Valley Lake clearly has the largest surface area, as well as the largest catchment area. Burncrooks Reservoir has the smallest surface area and catchment size, although Cheddar Reservoir has a similarly small catchment area. Each of the reservoirs are shallow, with mean depths of approximately 5m, except Pontsticill Reservoir which is deeper with a mean depth of 11.1m. The maximum depths between the three Bristol water reservoirs differ, with Blagdon Lake and Chew Valley Lake having greater maximum depths than Cheddar Reservoir.
Table 3.2: Reservoir characteristics (Centre for Ecology and Hydrology, n.d.)
| Barcraigs | Burncrooks | Blagdon | Cheddar | Chew Valley | Pontsticill | |
| Surface area (hectares) | 105 | 46 | 165 | 92 | 465 | 97 |
| Mean depth (m) | 5.26 | 5.5 | 4.8 | 5.8 | 4.3 | 11.1 |
| Max depth (m) | – | – | 11.5 | 6.4 | 10 | – |
| Catchment area (hectares) | 651 | 431 | 2179 | 480 | 5790 | 3340 |
Table 3.3 shows the percentage of months throughout the time period in which data was collected that the Mn level remained below the UK national requirements, this has been calculated based on the average monthly Mn levels. For drinking water in the UK, Mn concentration must be below 50 μg/l. Cheddar Reservoir was below this level 99% of the time over the course of data collection, while Chew Valley Lake was only 39% of months. This table also shows the percentage of months below the UK guidelines while no aeration was in place, and while either seasonal or full-time operation aeration was in place.
Table 3.3: Percentage below UK guidelines for manganese
| Barcraigs | Burncrooks | Blagdon | Cheddar | Chew Valley | Pontsticill | |
| Pre-aeration | 75 | 66 | 58 | – | – | 92 |
| Seasonal aeration operation | 72 | 77 | 54 (5 systems)
70 (7 systems) |
99 | 39 | 78 |
| Full-time aeration operation | – | 100 | – | – | – | – |
| Overall | 74 | 79 | 62 | 99 | 39 | 91 |
Table 3.4 gives the overall decrease in Mn in percentage form after installation of aeration systems and changes in operation of the systems. This excludes Cheddar Reservoir and Chew Valley Lake as the systems were installed before the data began being recorded, so this comparison cannot be made. Small decreases in Mn concentrations can be seen in Pontsticill Reservoir and Barcraigs Reservoir, while larger decreases are present in Burncrooks Reservoir and Blagdon Lake.
Table 3.4: Overall Mn percentage decrease
| Barcraigs | Burncrooks | Blagdon | Pontsticill | |
| % change (%) | -16 | -58 (seasonal)
-48 (full-time) -78 (overall |
0 (5 systems)
-60 (7 systems) -60 (overall) |
-21 |
Aeration system installation is illustrated on the figures in this dissertation by a red vertical line at the time of installation. The UK national requirement Mn level will be shown with a horizontal blue line at 50 μg/l. The graphs below show the monthly fluctuations in Mn levels and temperature throughout the time period of data collection.
Figures 3.1 and 3.2 show the Mn levels in Barcraigs Reservoir and Burncrooks Reservoir recorded by Scottish Water between 2005 and early 2016 and the maximum and minimum monthly air temperatures of Paisley, Renfrewshire recorded by the Met Office. Paisley is a town located approximately ten miles from Barcraigs Reservoir and approximately 15 miles from Burncrooks Reservoir.
The ResMix aeration system was installed in Barcraigs Reservoir in June 2012. Figure 6.1 shows a correlation between Mn levels and temperature, clear peaks in Mn can be seen be seen during the summer months when the temperature increases. However, peaks at times of lower temperatures can also be seen. Little change can be seen after the system is installed, though the very high peak Mn level in autumn 2011 was not repeated after the installation.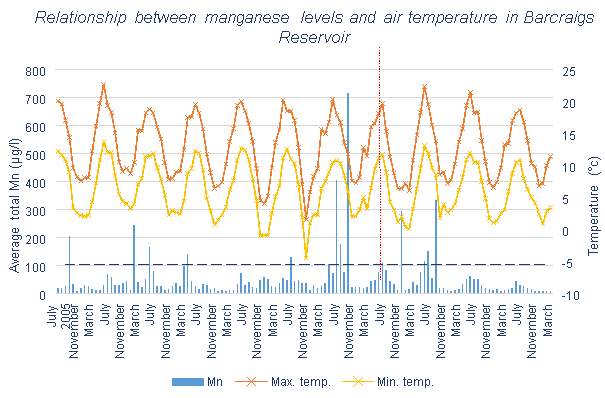
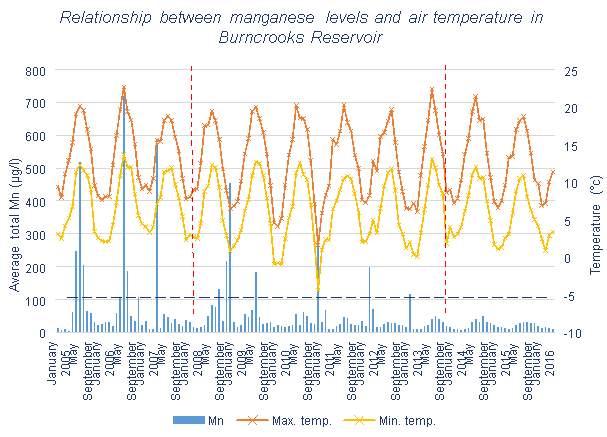
Figure 3.2, similarly to Figure 3.1, shows a correlation in Mn level and temperature fluctuations, but irregular winter Mn peaks are also present. However, there is a much more noticeable decrease in Mn levels due to the ResMix, consistent with the data at Table 3.4 for Burncrooks Reservoir.
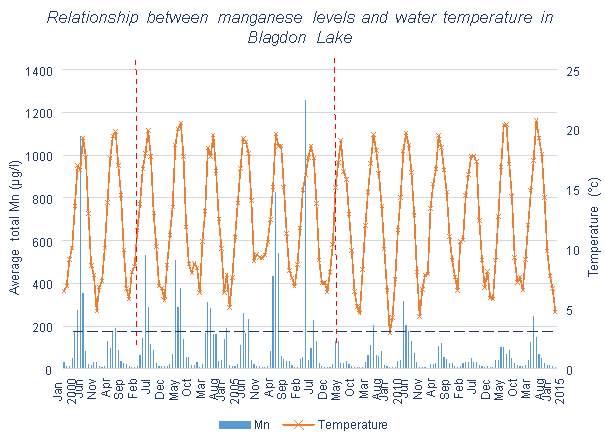
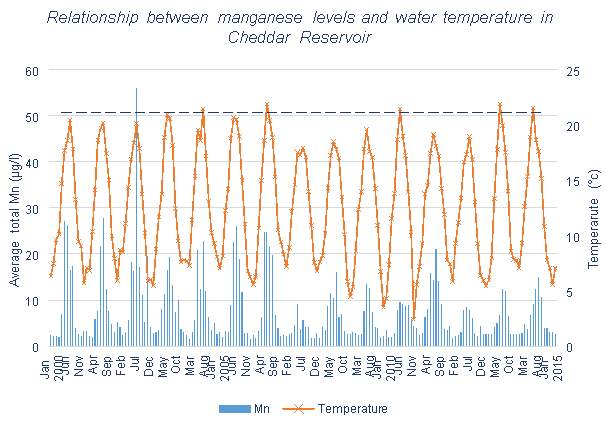
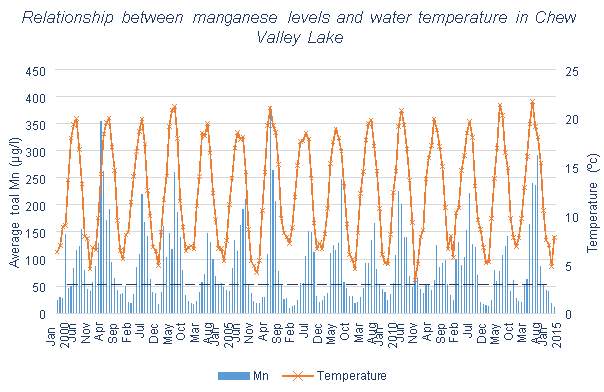
Figures 3.3, 3.4 and 3.5 all show total Mn levels in the water samples, and the temperature of the water, both of which have been recorded by Bristol Water for Blagdon Lake, Cheddar Reservoir and Chew Valley Lake respectively. For the purposes of this dissertation the monthly average total Mn concentration has been calculated from weekly/bi-weekly data.
Figure 3.3 shows that little change occurred in the Mn levels at Blagdon Lake once the first five Aquaerators were installed. However, after the further installation of two more systems there was a significant decrease. Both Figures 3.4 and 3.5 contain data collected since the aeration systems were installed, meaning that comparisons cannot be made between before and after aeration. All three lakes or reservoirs show clear temperature effects on the Mn concentration of the reservoirs, with the exception of one winter containing an abnormal peak of Mn in 2004-2005.
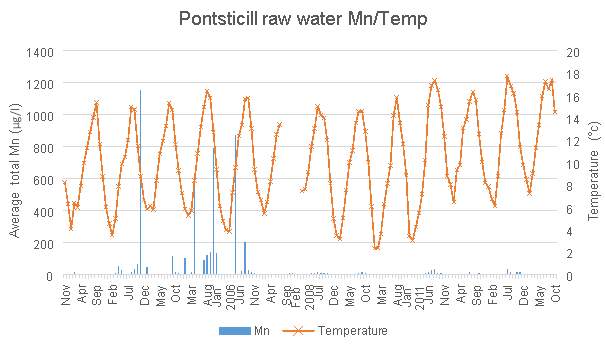
Mn levels in Pontsticill Reservoir are shown in Figures 3.6 and 3.7. Between 2003 and 2006 there were four significant peaks in Mn concentration which were a great deal higher than anything seen outside of this time period. For this reason, Figure 3.7 is useful in examining the fluctuations in Mn in greater detail, due to the scaling issues caused by those outlying Mn levels. This allows the effects of the aeration system to be seen in greater detail, particularly due to the lack of data available since 2014. The addition of the aeration system appears to have led to an increase in Mn levels when looking at Figure 3.7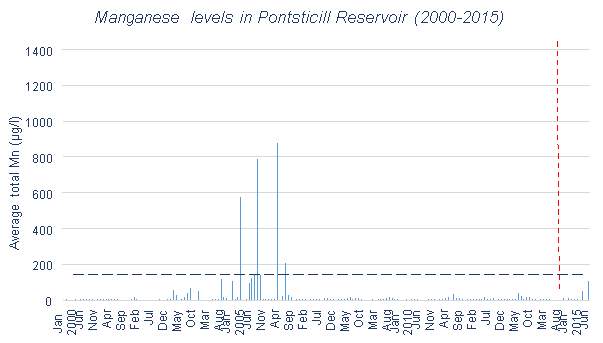
.
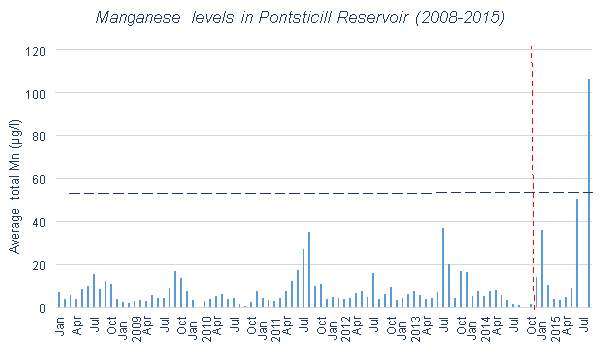
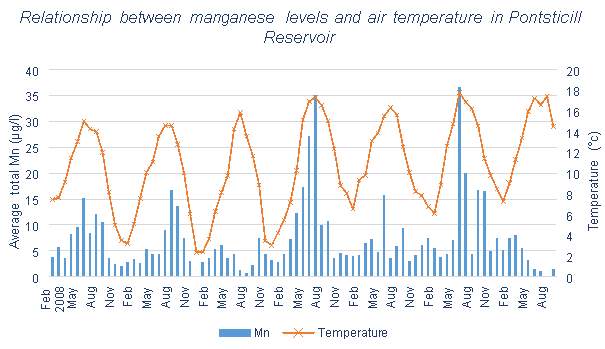
Figure 3.8 shows some correlation between average total Mn and temperature, but not as significant correlation as others have shown. Data given by Welsh Water contained temperature information until the end of 2014, and describes the air temperature of the area of Pontsticill. The monthly averages used in Figures 3.6, 3.7 and 3.8 have been calculated 
based on data provided by Welsh Water.
The data for algae from the Bristol Water lakes and reservoirs, shown in Figures 3.10, 3.11 and 3.12, each have similar trends. There appears to be some, however less than with Mn, correlation between number of algal cells and temperature. Spikes in algal cell count can generally be seen during summer and autumn months. And each tends to have an increase in algal cells over time rather than a decrease, which is what would hope to be achieved with the use of aeration systems.
Welsh Water has provided data for the MIB levels in Pontsticill Reservoir between 2010 and 2015 (with some missing data between 2010 and 2011). Figure 3.13 aims to show the effects of aeration on the MIB levels. Although the effects are unclear due to limited data, no decrease is evident, instead it appears to show an increase in MIB levels. Figure 3.14 compares the air temperature at Pontsticill (the air temperature data stops in 2014) and MIB levels. A correlation between temperature and MIB levels can be seen here, as MIB seems to increase when temperature does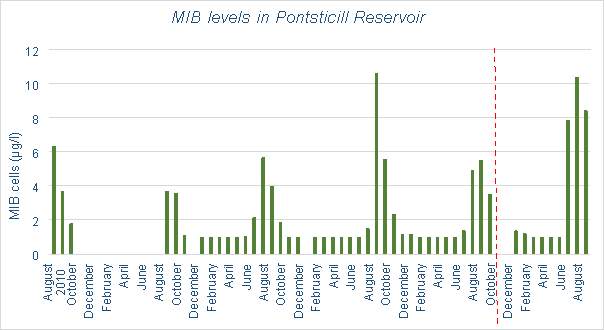
.
Figures 3.1, 3.2, 3.3, 3.4, 3.5, 3.8 and 3.9 show clear seasonal variations in Mn levels due to increasing temperatures. This clearly displays the effects of thermal stratification on Mn levels in reservoirs. More dramatic variations can be seen in some reservoirs when compared to others, this is illustrated on the graphs, and can also be seen in Table 3.1 by looking at the mean and maximum values of Mn found in the reservoirs.
Throughout the figures showing the relationships between Mn levels and temperature, Mn spikes are present where they would not be expected, i.e. outside the summer months. It is difficult to determine the causes of these spikes, as they do not seem to be linked to the parameters of this study. It is also shown that some increases in Mn during the summer are more dramatic than others, some summer peaks will be low while some are extraordinarily high. A few possible explanations for these phenomena are listed here.
- Winter stratification can occur if temperatures are low enough. This would isolate the lower layers of the lake from the atmosphere in a similar manner to summer stratification, leading to lower levels of dissolved oxygen in the hypolimnion leading to increased levels of Mn.
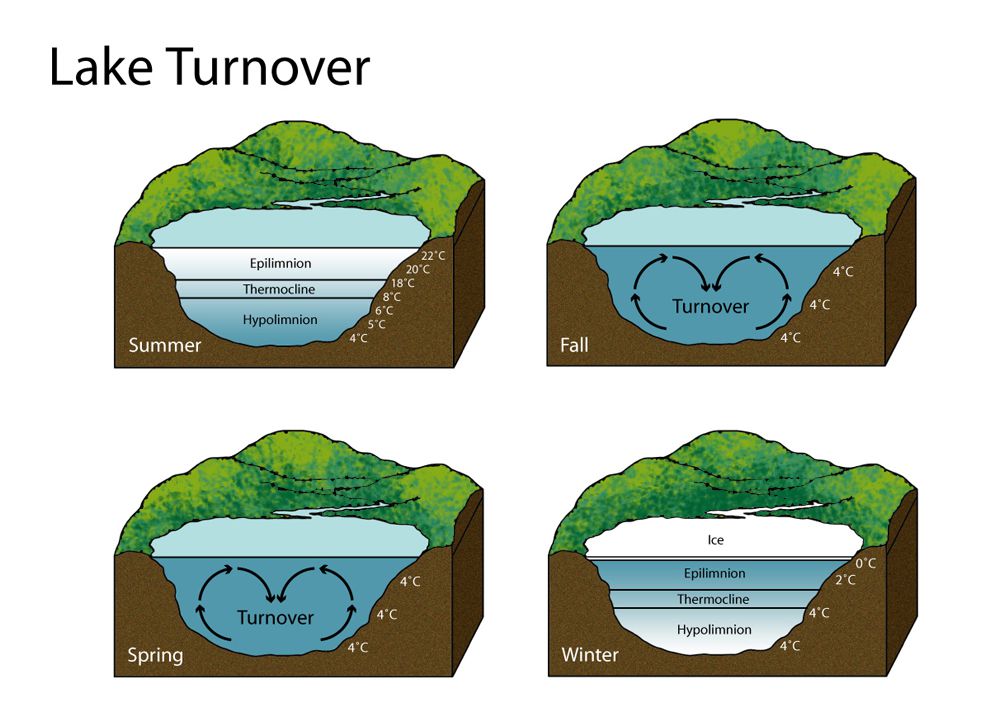
Spring and autumn turnover occurs in reservoirs due to the changes in water density with temperature causing convection in the water. This turnover mixes the reservoir entirely. Immediately after this has occurred, high levels of Mn would be found throughout the water column which has been mixed upwards from the bottom waters and sediment. Autumn (fall) turnover is likely to occur in the UK, however spring turnover is less likely as it depends on the formation of winter stratification.
Figure ?.?: Lake Turnover http://www.nationalgeographic.org/media/lake-turnover/
- An unusually warm winter could lead to lower levels of Mn. If, during winter, the water has not reached temperatures as low as normal, the reservoir will stratify to a lesser degree. Higher levels of DO will be present because of this, so lower levels of Mn should also occur. This would also be likely to lead to an increase in algal cells, as more nutrients will be mixed up to the surface waters, and a deeper portion of the reservoir would have access to the atmosphere, meaning that algae dwelling deeper in the lake will have access to sunlight and oxygen so it can multiply.
- If the water does not cool to below 4°C in the winter, spring turnover will not occur. Without the reservoir turning over in the spring, it will not be mixed before summer stratification sets in, which could worsen its effects.
Blagdon Lake and Chew Valley Lake both have high mean Mn values, meaning that they are frequently above the UK Mn regulations for drinking water. This means that both reservoirs will regularly need to treat the water to lower Mn levels, which is what aeration aims to avoid.
Chew Valley Lake has a lower maximum Mn value than Blagdon Lake, from this and from Figure 3.5, it can be seen that Mn does not reach high peaks as often as in the other reservoirs (excluding Cheddar). There are many months that exceed the UK limit, but never by as extreme amounts as seen elsewhere. Even with aeration systems installed, all of summer and early autumn have high average Mn values. Little variation can be seen in this reservoir between years. These generally high Mn levels could be due to the large surface area of the reservoir and the large catchment size. A large surface area will lessen the effects of aeration, as they can only reach a certain distance away from them to destratify. Perhaps Bristol Water should consider increasing the number of aeration systems here. A large catchment size will increase the likelihood of surface runoff from agricultural land increasing the nutrient levels in the water.
Blagdon Lake and Pontsticill Reservoir both have high maximum values of Mn, meaning that they contain extreme Mn spikes. They have large ranges of Mn concentration, unlike Chew Valley, and these high peak values can be seen clearly on Figures 3.3 and 3.6.
The dramatic peaks seen in Blagdon Lake appear to have been eliminated in 2008. According to Aquarius (the company in charge of the Aquaerator installation), it was discovered that the main water outlet was 2m below the reservoir bed. This had been causing the extremely high Mn levels which had been found previously during the summer months, as this would have resulted in low DO and high Mn. Since the improvements were made to resolve this issue, and the addition of two further aeration systems, these peaks have been eliminated. Increases in Mn due to increasing temperatures still remain, however at a much smaller scale than previously. Although Blagdon Lake has a high mean value for Mn, as was previously mentioned, the overall Mn level percentage change shows a decrease since 2008, and the percentage of months remaining below UK requirements has increased.
Pontsticill Reservoir has a low mean value for Mn, especially when compared to its high maximum value. This is clearly represented in Figures 3.6 and 3.9. During 2003-2006, there is a series of particularly large peaks which are unexplained. This could be due to the weather conditions present in those years. For example there could have been higher levels of surface runoff than normal due to increased rainfall, which would have a great effect due to Pontsticill’s large catchment area. This could also be due to data collection errors. It is difficult to assess the effectiveness of the aeration system in place here, as there is little data available after the installation, but on the face of it the higher Mn levels after the autumn 2014 installation suggest it has raised Mn levels rather than lowered them.
Cheddar Reservoir has a very low mean Mn value, and a maximum value of 55μg/l, which is only slightly above the UK limit, these values are much lower than that seen in the other reservoirs studied in this dissertation. 99% of months are on average below the limit. This means that overall, Cheddar will need minimal water treatment works to obtain Mn levels at acceptable levels. This could be in part due to its: small catchment size, however this is of a similar size to that of Barcraigs and Burncrooks Reservoirs; lower maximum depth when compared with the other Bristol Water reservoirs. Table 3.1 shows that Cheddar Reservoir has a lower algal cell count than the other reservoirs. Algal growth is known to contribute to anoxic conditions and high levels of Mn, therefore lower algal cells could also lead to lower levels of Mn.
Both of the reservoirs run by Scottish Water, Barcraigs and Burncrooks Reservoirs, are shown in Table 3.1 to have means slightly higher than 50 μg/l, so it is likely that water treatment will be required to lower the Mn levels regularly. These reservoirs, like most other lakes and reservoirs, also have high maximum values, so have a large range of values. There is a lot of variation in values which can be seen by the presence of regular significant peaks in Figures 3.1 and 3.2.
Little change can be seen in Barcraigs Reservoir in Figure 3.1, which also shown in Table 3.3. The table states that the percentage of months with acceptable Mn levels actually decreases from 75% to 73% after the aeration system installation. Table 3.4 shows an overall percentage decrease of 16%, which is not particularly significant. However, since the installation of the ResMix system, the peaks of Mn have not been reaching such high levels, and from 2014 onwards no peaks significantly over 50 μg/l have occurred. If this were to continue in this manner, the need for water treatment would rarely be necessary, however the Mn levels need to be continuously monitored to see if this behaviour lasts.
A clear decrease can be seen in Figure 3.2 for Burncrooks Reservoir, which is also reflected in Table 3.3 and 3.4. Improvement can be seen after the installation of the ResMix system, this is followed by a further improvement once Scottish Water decided to operate the systems full-time rather than seasonally. Since the use of full-time operation, the Mn concentration has remained below 50 μg/l, the accepted standard for use as drinking water.
- Algae
The number of algal cells in the three Bristol Water reservoirs appears to be increasing over time, whether this is related to the installation of aerators is unclear. It is possible that while total algal mass is increasing, levels of cyanobacteria may still be decreasing. Cyanobacteria is a species of algae, also called blue-green algae, which can be harmful to the environment, animals, and human health (US EPA). This type of algae can produce toxins in the water, and the bloom decay contributes to anoxic conditions, which would contribute to the release of Mn, Fe and P from the sediment. Other species of algae may not have negative effects on drinking water. Since only algal mass is determined in this data, it is possible that levels of cyanobacteria are decreasing, but levels of non-toxic species of algae are increasing. Cyanobacteria is a buoyant species, meaning that it will remain in the surface waters where it is free to photosynthesise and multiply. Mixing will circulate the different species of algae throughout the water column, limiting the opportunity for the buoyant species to multiply, but also giving the lower dwelling algae the capability. As these non-toxic, non-buoyant species are now multiplying, the algal mass can increase, while quality of the water improves due to the lower amounts of toxic cyanobacteria.
When a reservoir is destratified, the cold, dark, undisturbed hypolimnion should be eliminated, increasing the availability of sunlight in the water. This would generally mean that more of the algae dwelling in the lake has access to sunlight and therefore, the ability to photosynthesise and multiply.
Another possible reason for the increase of algal mass is the increase of P due to runoff. P is known to contribute to algal growth, and even when the release from the sediment is inhibited due to aeration, it is still possible for P levels to increase in the reservoir. The levels of P have not been measured for the purposes of this study, so this theory cannot be tested.
There is correlation between the number of algal cells and temperature in the water, implying that multiplication of algae does occur more in the summer months. Considering that cyanobacteria is more likely to occur in stratified conditions (this is due to its buoyant nature, if the reservoir becomes stagnant due to thermal stratification it will be favoured to remain in the surface waters), it would follow that during months with higher temperatures, the levels of cyanobacteria would be higher. This is shown in Figure 6.14 in Pontsticill Reservoir, which shows the levels of MIB which is caused by the presence of cyanobacteria. This graph shows clear correlation between temperature and MIB concentration. Figure 3.13 shows that the introduction of an aeration system into this reservoir does not appear to have affected the levels of algae, though limited data has been collected after the installation.
- Is aeration effective?
From the results discussed in this dissertation, it is unclear whether aeration systems are an effective method of removing Mn and algal blooms from drinking water supply reservoirs. Conflicting results are displayed, some show significant improvement in Mn levels due to the use of aeration, while some show little difference. In regard to algae, the results displayed here are very unclear, as the species of algae is relevant in addition to the overall algal mass.
Little has been done previously in respect to the levels of manganese in lakes with engineered aeration systems installed, so there is not much comparison to be made. However literature discussed in this dissertation has shown that there is a clear link between manganese levels and consumer complaints due to aesthetic water quality, and organisations in charge of the quality of drinking water have set standards giving maximum levels of manganese which cannot be surpassed. Water utilities in the UK must avoid exceeding these limits as it will lead to fines, hence Bristol Water, Scottish Water and Welsh Water have installed aeration systems in the hope of improving their source water quality. Through improvement of source water quality, the costly and complex additional step in water treatment which must be added to remove Mn from water can be eliminated.
If water utilities hope to effectively improve source water quality, look should study their reservoir in great detail before deciding on an aeration method. Factors such as reservoir volume and hypolimnetic volume, oxygen demand, reservoir depth and hypolimnetic depth, and reservoir flowthrough should be taken into account when installing aeration equipment. There are many different types of device available, each with advantages and disadvantages based on reservoir charasteristics. If aeration is to be utilised properly, these factors should be taken into account in order to choose the most appropriate device. It would be unproductive to ignore these characteristics, as there are high costs associated with the installation of aeration systems and some devices can prove ineffective in certain situations. Once the type of device has been chosen, it is also important to size the system effectively. For example the ResMix systems have a range of options available. For bubble plume systems, the amounts of air or oxygen being pumped into the water must be decided, and should be based on the levels of dissolved oxygen needed.
Water utilities will typically take weekly or bi-weekly samples from the water treatment plant before the water has been treated, however it would be necessary to use a more comprehensive sampling and assessment strategy to improve the study (for example, that outlined by CHW). For example samples should be taken from multiple locations in-situ so that a 3D assessment could be carried out, and these samples assessed for other parameters including Mn, Fe, P, cyanobacteria, DO and temperature. This would be a much more complex and technical analysis which would allow a greater understanding of the reservoir.
Only two types of aeration system have been analysed in this study, both being destratification systems. In order to effectively discuss the effectiveness of aeration systems in general, a greater range of systems should be assessed.
An important limitation in this dissertation is the limited data received from the water utilities, and limited information on the type of system and dates of installation. No installation details have been provided for Chew Valley Lake and Cheddar Reservoir, so the assumption was made that the systems were installed before the data collection began. This limited the ability to assess the aeration systems.
This study has been limited by the small range of data available. It would be useful to have access data collected both before and after the installation of the aeration systems, in order to see trends in Mn levels and algal cell count. It would be useful to know whether the levels of algae in the lake were changing due to the effects of aeration, or if they had been changing over time unrelated to the aeration. Particularly for Pontsticill Reservoir, very limited data was available after the installation of the aeration system, so not enough time has passed to properly discuss any changes occurring.
An increase in understanding and knowledge of aeration systems and their effects of the physical and geochemical processes controlling manganese distribution in reservoirs will lead to optimised aeration operations and management of more sustainable water supplies throughout the UK and globally. Considering that almost all UK water utilities use these systems in their drinking water supply reservoirs, it is a field which should be explored. If more was known, and the systems became more efficient, it would lead to less waste of money and energy, and the use of less chemicals in the water treatment process.
A series of large scale studies should be conducted including a range of system types on a number of reservoirs. Knowledge of reservoir characteristics should be gained including oxygen demand, reservoir volume and depth, catchment size and type etc., and levels of Mn, Fe, P, algae, cyanobacteria, DO should be measured at a number of points in the reservoir at depth intervals of approximately 1m or 2m. This will allow a detailed analysis to be carried out on the relationships between these parameters.
Ashley, K.A., 1983. Hypolimnetic aeration of a naturally eutrophic lake: physical and chemical effects. Can. J. Fish. Aquat. Sci., 40, pp 1343-1359.
Ashley, K.A., Hay, S., Scholten, G.H., 1987. Hypolimnetic aeration: field test of the empirical sizing method. Wat. Res., 21, pp 223-227.
AWWA, American Water Works Association, 1987. Committee Report: Research Needs for the Treatment of Iron and Manganese. Designing Treatment Facilities, 79(9), pp 119-122.
Beutel, M., Hannoun, I., Pasek, J., Kavanagh, K.B., 2007. Evaluation of hypolimnetic oxygen demand in a large eutrophic raw water reservoir, San Vicente Reservoir, Calif. Journal of Environmental Engineering 133(2), pp 130–138.
Bryant, L., Gantzer, P., Little, J., 2011. Increased sediment oxygen uptakes caused by oxygenation-induced hypolimnetic mixing. Water Research 45, 45(12), pp 3692-3703.
Burns, F.L., 1998. Case study: automatic reservoir aeration to control manganese in raw water Maryborough Town Supply Queensland, Australia. Water Science and Technology, 37(2), pp 301–308.
Chipofya, V.H., Matapa, E.J., 2003. Destratification of an impounding reservoir using compressed air – case of Mudi reservoir, Blantyre, Malawi. Physics and Chemistry of the Earth 28(20–27), pp 1161–1164.
Cooke, G.D., Carlson, R.R., 1989. Reservoir Management for Water Quality and THM Precursor Control. American Water Works Association Research Foundation, Denver, CO.
Gantzer, P. A., Bryant, L. D., Little, J. C., 2009. Effect of hypolimnetic oxygenation on oxygen depletion rates in two water-supply reservoirs, Water Research 43, pp 1700-1710.
Gantzer, P. A., Bryant, L. D., Little, J. C., 2009. Controlling soluble iron and manganese in a water-supply reservoir using hypolimnetic oxygenation, Water Research 43, pp 1295-1294.
Griffin, A. E., 1960. Significance and removal of manganese in water supplies. Journal AWWA, 52, 1326-1334.
Grochowska, J., Gawronska, H., 2004. Restoration effectiveness of a degraded lake using multi-year artificial aeration. Polish Journal of Environmental Studies 13(6), pp 671–681.
Hart, B. T., 1974, A Compilation of Australian Water Quality Criteria, Australian Water Resources Council Technical Paper No. 7. Australian Government Publishing Office, Canberra.
Haynes, R., 1971. Some ecological effects of artificial circulation on a small eutrophic New Hampshire lake. Ph.D. Thesis. Univ. N. H., Durham, N. H. 165 pp.
Heal, K.V., 2001. Manganese and land-use in upland catchments in Scotland. Science of the Total Environment, 265(1-3), pp 169-179.
Hondzo, M., Feyaerts, T., Donovan,R., O’Connor, B.L., 2005. Universal scaling of dissolved oxygen distribution at the sediment-water interface: A power law. Limnology and Oceanography, 50(5), pp 1667-1676.
Hooper, F. F., Ball, R. C., Tanner, H. A., 1952. An experiment in the artificial circulation of a small Michigan lake. Trans. Am. Fish. Soc. 82:222-241
Hudnell, H. K., Jones, C., Labisi, B., Lucero, V., Hill, D. R., Eilers, J., 2010. Freshwater harmful algal bloom (FHAB) suppression with solar powered circulation (SPC). Harmful Algae 9: 208-17
Ismail, R., Kassim, M.A., Inman, M., Baharim, N.H., Azman, S., 2002. Removal of iron and manganese by artificial destratification in a tropical climate (Upper Layang Reservoir, Malaysia). Water Science and Technology 46(9), pp 179–183.
Krauskopf, K.B., Bird, D.K., 1995. Introduction to Geochemistry. 3rd ed. London: McGraw-Hill, pp 647.
Liboriussen, L., Sondergaard, M., Jeppesen, E., Thorsgaard, I., Grunfeld, S., Jakobsen, J. S., Hansen, K., 2009. Effects of hypolimnetic oxygenation on water quality: results from five Danish lakes, Hydrobiologia, 625, pp 157-172
Lorenzen, M.W., Fast, A.W., 1997. A guide to aeration/circulation techniques for lake management. EPA-600/3-77-004, U.S. EPA, Washington, D.C.
Madigan, M.T., Martinko, J.M., Parker, J., 2003. Brock Biology of Microorganisms, tenth ed. Pearson Education Inc., New Jersey, pp. 115–116,576.
Malueg, K., Tilstra, J., Schults, D., Powers, C. F., 1971. The effect of induced aeration upon stratification and eutrophication processes in an Oregon farm pond. Presented at the Int. Symp. On Man-Made Lakes, Knoxville, Tenn., May 1971.
Matthews, D.A., Effler, S.W., 2006a. Assessment of long-term trends in the oxygen resources of a recovering urban lake, Onondaga Lake, New York. Lake and Reservoir Management 22 (1), 19–32.
McGinnis, D.F., Little, J.C., 2002. Predicting diffused-bubble oxygen transfer rate using the discrete-bubble model. Water Research 36, 4627–4635.
Md. Saidul Azam Chowdhury, Khairul Hasan, and Kaosar Alam, “The Use of an Aeration System to Prevent Thermal Stratification of Water Bodies: Pond, Lake and Water Supply Reservoir.” Applied Ecology and Environmental Sciences 2, no. 1 (2014): 1-7. doi: 10.12691/aees-2-1-1.
Mercier, P., Perret, J. Aeration of Lake Bret, Monastbull, Schwiez.Ver. Gas. Wasser-Fachm 1949, 29, 25.
Moore, B., Mobley, M., Little, J., Kortmann, B., Gantzer, P., 2015. Aeration and Oxygenation Methods for Stratified Lakes and Reservoirs [Online]. Available from: http://z0ku333mvy924cayk1kta4r1.wpengine.netdna-cdn.com/wp-content/uploads/LakeLine/35-1/Articles/35-1-4.pdf [Accessed 20/11/2016].
Pakhomova, S.V., Hall, P.O.J., Kononets, M.Y., Rozanov, A.G., Tengberg, A., Vershinin, A.V., 2007. . Marine Chemistry 107(3), pp 319–331
Ridley, J., 1971. Water supply lakes and raw water storage reservoirs. Report to Water Supply Prog. Div., Water Qual. Off. U.S. Environ. Prot. Agency. 34 pp.
Singleton, V.L., Little, J.C., 2006. Designing Hypolimnetic Aeration and Oxygenation Systems – A Review. Environ. Sci. Technol., 40, pp 7512-7520.
Sly et al., 1989, the Importance of High Aesthetic Quality Potable Water in Tourist and Recreational Areas, Wat. Sci. Tech. Vol 21, No. 2, pp 183-187
Sly L. I., 1987. Investigation into Biological Manganese, Oxidation and Deposition in the Gold Coast Water Distribution System. UniQuest, University of Queensland, Australia.
Sly, LJ., Hodgkinson, MC., Arunpairojana, V., 1990. Deposition of manganese in a drinking water distribution system. Appl Environ Microbiol, 56(3), pp 628-639.
Smith, S.A., Knauer, D.R., Wirth, L.T., 1975. Aeration as a lake management technique. Wisconsin Dept. Nat. Resour., Technical Bulletin No. 87, pp 39.
Soltero, r.a., Sexton, l.m., Ashley, k.i., McKee, k.o., 1994. Partial and full lift hypolimnetic aeration of Medical Lake, WA to improve water quality. Wat. Res., 28, pp 2297-2308.
Taggart, c.t., McQueen, d.j., 1981. Hypolimnetic aeration of a small eutrophic kettle lake: physical and chemical changes. Arch. Hydrobiol., 91, pp 150-180.
United States of America Environmental Protection Agency (1987). National secondary drinking water regulations. (Personal communication).
Visser, P., Ibelings, B., Van Der Veer, B., Koedood, J., Mur R. (1996). Artificial mixing prevents nuisance blooms of the cyanobacterium Microcystis in Lake Nieuwe Meer, the Netherlands. Freshwater Biology 36: 435-450
World Health Organisation, 2004. Guidelines for Drinking-water Quality, Volume 1 Recommendations, 3rd edition
World Health Organization (1971). International Standards for Drinking-Water, 3rd ed. World Health Organization, Geneva.
World Health Organization (1984a). Guidelines for Drinking-Water Quality, Vol. 1. World Health Organization, Geneva.
Wuest, A., Brooks, N.H., Imboden, D.M., 1992. Bubble plume modelling for lake restoration. Water Resour. Res., 28, pp 3235-3250.
Zaw, M., Chiswell, B., 1999. Iron and manganese dynamics in lake water. Water Research 33 (8), pp 1900–1910
Izaguirre, G., Taylor, W. D., 2004. A guide to geosmin- and MIB-producing cyanobacteria in the United States. 49(9), pp. 19-24
Patil, A., et al., 2013. Taste and odour [online]. Lisle, Illinois: Water Quality Association. Available from: https://www.wqa.org/LinkClick.aspx?fileticket=UzyTWNS66UY%3D&portalid=0 [accessed 23/04/2017]
Spohrer, C., et al., 2017. Oxidation-Reduction Reactions. California: UC Davis, University of California. Available from https://chem.libretexts.org/Core/Analytical_Chemistry/Electrochemistry/Redox_Chemistry/Oxidation-Reduction_Reactions [Accessed 24/04/2017]
NSW Government, 2016. What causes algal blooms. New South Wales: NSW Government Department of Primary Industries. Available from http://www.water.nsw.gov.au/water-management/water-quality/algal-information/what-causes-algal-blooms#page-content [Accessed 23/04/2017]
Toxic cyanobacteria in water A guide to their public health consequences, monitoring and management, 1999. London: WHO.
Ljung, K., Vahter, M., 2007. Environ Health Perspect. 115(11), pp. 1533–1538
U.S. Environmental Protection Agency Office of Water, 2004. Drinking Water Health Advisory for Manganese [Online]. Available from: https://www.epa.gov/sites/production/files/2014-09/documents/support_cc1_magnese_dwreport_0.pdf [Accessed 23/04/2017]
Drinking Water Inspectorate, 2010. What are the drinking water standards [Online]. Available from: http://dwi.defra.gov.uk/consumers/advice-leaflets/standards.pdf [Accessed 23/04/2017]
Perks, C., 2006. Dealing with stratification within a water supply reservoir. 69th Annual Water Inductry Engineers and Operators’ Conference, 5-7 September 2006 Bendigo Exhibition Centre. Bendigo: Central Highlands Water, pp 30-36.
US Environmental Protection Agency, 2014. Cyanobacteria and Cyanotoxins: Information for Drinking Water Systems. Available from: https://www.epa.gov/sites/production/files/2014-08/documents/cyanobacteria_factsheet.pdf [Accessed 23/04/2017]
US Environmental Protection Agency, 2017. Secondary Drinking Water Standards: Guidance for Nuisance Chemicals [Online]. Available from: https://www.epa.gov/dwstandardsregulations/secondary-drinking-water-standards-guidance-nuisance-chemicals [Accessed 14/04/2017]
NHMRC, NRMMC, 2011. Australian Drinking Water Guidelines, Paper 6, National Water Quality Management Strategy. Commonwealth of Australia, Canberra: National Health and Medical Research Council, National Resource Management Ministerial Council.
Met Office (n.d.). Paisley [Online]. Available from: http://www.metoffice.gov.uk/pub/data/weather/uk/climate/stationdata/paisleydata.txt [Acessed 09/04/2017]
Gurney Environmental (n.d.). ResMix Source Management [Online]. Available from: http://gurneyenvironmental.com/index.php/systems/item/77-resmix-source-management [Accessed 10/04/2017]
http://dwi.defra.gov.uk/consumers/advice-leaflets/algal.pdf good stuff on algae
Cite This Work
To export a reference to this article please select a referencing stye below:
Related Services
View all


Related Content
All TagsContent relating to: "Technology"
Technology can be described as the use of scientific and advanced knowledge to meet the requirements of humans. Technology is continuously developing, and is used in almost all aspects of life.
Related Articles

DMCA / Removal Request
If you are the original writer of this dissertation and no longer wish to have your work published on the UKDiss.com website then please: