Interfacial Properties of Asphaltenes at Oil/Water Interface
Info: 26488 words (106 pages) Dissertation
Published: 9th Dec 2019
Tagged: ChemistryOrganic Chemistry
Abstract
Asphaltenes are the heaviest components in crude oil. It is generally believed that asphaltenes adsorbed at oil/water interface can form a protective layer to stabilize the water-in-oil emulsions. Therefore, it is of both fundamental and practical importance to understand the adsorption kinetics of asphaltenes to the oil/water interface. In this work, the effects of asphaltene concentration and temperature on the dynamic interfacial tension (IFT) of oil/water interface were investigated using pendent drop shape method. The adsorption process showed three stages as a function of adsorption time. It was found that the reduction kinetics of interfacial tension in the initial state (Regime I) was diffusion-controlled, during which asphaltenes were adsorbed to the oil/water interface spontaneously. Diffusion coefficient was found to increase with increasing temperature and decreasing asphaltene concentration. While asphaltene concentration showed a dominant influence on the diffusion coefficient as compared with temperature. With increasing adsorption time, in the Regime II, the steric hindrance arisen from the adsorbed asphaltenes at oil/water interface tended to inhibit the further adsorption. Continuous adsorption of asphaltenes to the sublayer of the interface and reconfiguration of adsorbed asphaltenes might contribute to the continuous reduction of dynamic interfacial tension in Regime III. The experimental data was fitted with Gibbs adsorption model, which showed that elevated temperature had a negative impact on the maximum surface excess concentration of asphaltene.
Calcium chloride is salinity common salt present in low-salinity water flooding which is an efficient process for enhanced oil recovery (EOR). In this thesis, the effect of calcium chloride concentration on the interfacial tension and dilatational interfacial rheology was investigated and further validated by emulsion stability experiments. It was found that with increasing calcium chloride concentration both the dynamic interfacial tension and surface pressure increased. Diffusion coefficient and maximum interfacial excess concentration of asphaltenes were enhanced with the existence of calcium chloride in the aqueous phase. The results of dilatational interfacial rheology and compressibility studies have demonstrated that calcium chloride could induce the rearrangement of asphaltene molecules and form a more rigid film at the oil/water interface. The results of interfacial tension, dilatational interfacial rheology and emulsion stability tests further demonstrate that calcium chloride could significantly influence the stability of water-in-oil emulsions. Our results provide useful information regarding the adsorption kinetics and adsorption mechanism of asphaltenes at oil/water interface in oil production, as well as the correlation between interfacial properties and emulsion stability in the presence of asphaltenes, particularly under high temperature conditions and with calcium chloride.
Preface
Dedication
‘O ever youthful O ever weeping’
——– Jack Kerouac
‘It’s better to burn out than to fade away’
——– Kurt Cobain
‘Keep your elegance wherever you are’
——– A true friend
Table of Content
1.1 Background information of asphaltenes
1.2 Asphaltenes aggregation behaviors
1.3 Interfacial tension studies
1.4 Interfacial dilatational rheology studies
Chapter 2 Experimental Techniques
2.2 Dynamic Light Scattering (DLS)
2.2.2 Principle of Dynamic Light Scattering
2.3 Contact Angle Goniometer and Tensiometer
3.2 Experiment Materials and Methods
3.2.4 Dynamic Light Scattering (DLS).
3.3.1 Particle Size of Asphaltenes.
3.3.2 Dynamic Interfacial Tension versus Time.
3.3.3 Adsorption Process of Asphaltenes
Chapter 4 Calcium Chloride Effect on the Interfacial Properties of Asphaltenes
4.2.3 Dynamic interfacial tension tests
4.2.4 Interfacial dilatational rheology tests
4.2.6 Emulsion stability studies
4.4.1 Dynamic IFT and Surface Pressure
4.4.2 Interfacial Dilatational Rheology
Chapter 5 Conclusions and Future Works
List of Tables
List of Figures
Figure 2.1 Zetasizer Nano ZS by Malvern Instruments, UK
Figure 2.2 Scheme of optical arrangement of the equipment [2].
Figure 2.3 Contact angle goniometer and tensiometer used by Ramé-hart Instrument Company.
List of Acronyms
CCC Critical clustering concentration
CCD Charged-coupled Device
CMC Critical Micelle Concentration
CNAC Critical Nanoaggregation Concentration
DLS Dynamic Light Scattering
EOR Enhanced Oil Recovery
FTIR Fourier Transform Infrared Spectroscopy
HS High-Salinity
IFT Interfacial Tension
LS Low-Salinity
NIBS Non-Invasive Backscatter optics
NMR Nuclear Magnetic Resonance
PCS Photon Correlation Spectroscopy
SARA Saturate, Aromatic, Resin, Asphaltene
Chapter 1 Introduction
Asphaltenes are the heaviest and common components existing in the crude oil from various sources, which are conventionally defined as a solubility class: soluble in aromatic solvent (e.g. toluene) and insoluble in alkane solvent (e.g. n-pentane or n-heptane) [1-3]. Asphaltenes can cause detrimental phenomena in the oil and gas industry both in the upstream and downstream of the industry [5, 6]. During the extraction process of the upstream, the extremely heavy asphaltenes increase the cost significantly by elevating the viscosity of the crude oil, being adsorbed to the rock surface and plugging the pores, changing the wettability of the surface of reservoir and wells. During the process of hydrotransportation and refinery, the aged asphaltenes contribute to rigid film at the oil/water interface, strengthen the stability of water-in-oil emulsions or oil-in-water emulsions, lead to pipeline corrosion, plug the transportation pipeline, and form the coke which is undesirable to process efficiency. In consequence, asphaltenes have been widely studied by many researchers, including but not limited to the structure and the molecular weight of asphaltenes, adsorption to metallic and non-metallic solid surface, asphaltenes aggregation and precipitation, adsorption to the oil/water interface.
As asphaltenes are complex mixtures consisting of many molecules, it is really hard to define a standard molecular structure or molecular weight for asphaltenes. With the development of analysis technology, there is a controversy between two main structure models, namely archipelago model and island model [7, 8]. According to the results supporting the archipelago model, it was believed that the typical asphaltene molecule contained several aromatic segments connected to each other by alkyl groups or sulphide functional groups. However, more recent studies by Groenzin and Mullins [9] postulated the island model of asphaltene molecule showing the availability of this typical structure of asphaltene molecule, which could be further elucidated that asphaltene molecule was comprised of a polyaromatic core with the most probable seven fused aromatic rings and aliphatic chains attached to the sides of the core. It was found that carbon atoms were attributed a lot to the formation of aromatic rings which further formed the polyaromatic core, for instance in Athabasca asphaltenes 40 % of which existed in the aromatic rings. The molecular weight of asphaltene molecule ranged from 500 to 1000 Da with an average molecular mass about 750 Da conforming to the island model hypothesized by Groenzin and Mullins, the value of which was smaller than that of archipelago model roughly ranging from 2000 to 6000 Da [4]. In addition, the elemental investigation of asphaltenes was achieved by conducting the experiments through Fourier transform infrared spectroscopy (FTIR), nuclear magnetic resonance (NMR), etc. The heteroatoms are mainly N, S and O [10], which contributes to the functional groups such as pyrrolic, quinoline, thiophene, sulfoxide, hydroxyl and carbonyl containing negative and positive charges. Except for these nonmetallic elements, metallic elements like iron, nickel, and vanadium were found in metal porphyrins responsible for the fouling problems [11].
Asphaltene aggregation is a key behavior in the studies of asphaltene adsorption to the oil/water interface or solid surface, emulsion stability and solubility in the organic phase with different polarity. A couple of decades ago, when the understanding of asphaltene behaviors was in its initial stage, the surface-active asphaltenes were likened to surfactants. The asphaltene aggregates in the crude oil or organic solvents, with resins surrounding the core of asphaltenes, were analogized as the reverse surfactant micelle. Thus, the ratio effect of resins to asphaltenes has been considered as one of the significant aspects to the theoretical studies of asphaltenes. The aggregation behavior of asphaltenes in organic solvents was previously described as critical micelle aggregation (CMC) by plotting the IFT data versus asphaltene concentration [12]. However, the mechanism of CMC was of questionable validity in the case of asphaltenes, and even for surfactants. To the surfactants in aqueous systems, normally 50 – 100 (aggregation number) surfactant molecules constitute the typical micelles if the surfactant concentration is higher than CMC [4]. But if the aggregation number is lower than 50, or as low as less than 10, no apparent CMC would be observed since micelle concentration increases gradually with increasing surfactant concentration from the beginning. As the obvious differences between asphaltenes and surfactants regarding the aggregation number, CMC was not quite appropriate to describe the aggregation behavior of asphaltenes. Instead, critical nanoaggregation concentration (CNAC) and critical clustering concentration (CCC) started to be accepted widely by researchers along with Yen-Mullins model [13]. Yen-Mullins model shows that the island like asphaltene molecules (~ 1.5 nm) form nanoaggregates or dimers with an aggregation number less than ten at sufficient concentration as shown in Figure 1.1. The CNAC is generally measured as 50 – 100 mg/L or sometimes as low as 20 – 50 mg/L by different sources of asphaltenes. At higher concentration beyond CCC, nanoaggregates can further form clusters in crude oil or organic solvent with also less than ten aggregation numbers. It has been reported that π-π interaction between polyaromatic cores contributes to the formation of nanoaggregtion. Successive stacking of asphaltene molecules is obstructed by the steric hindrance of aliphatic side chains. The clusters are formed because of unavoidable cross-linking and van da Waals forces between nanoaggregates. The behavior of asphaltene aggregation is highly dependent on the asphaltene concentration, sources of asphaltenes, temperature, pressure, polarity of bulk solution, etc.
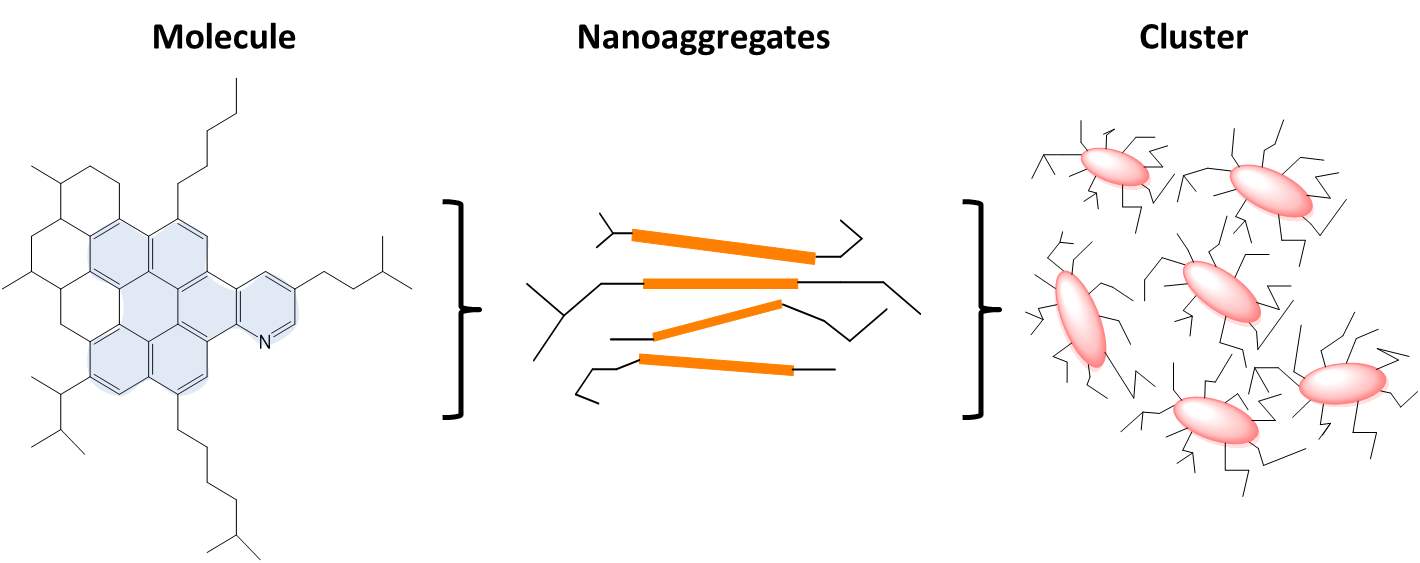
Figure 1.1A typical asphaltene aggregation process was listed from left to right which is so-called Yen–Mullins model [2].
The concept of interfacial tension (IFT) originally comes from surface tension specifically describing liquid-liquid system or liquid-solid system. As the difference between the interaction of the molecules in one phase and that of the other phase, external work should be done to the molecules if moved from one bulk phase to the specific interface boundary. So in general, interfacial tension can be defined as the work to be added to increase the adjacent area by two immiscible phases [14]. The proportionality factor γ is to describe surface tension as well as IFT. Energy per unit area (J/m2) and force per unit length (N/m) are the units to surface tension or IFT. According to the physical meaning, surface tension or IFT is a two-dimensional notion associated with energy. Additionally, no tangent force essentially occurs at the entire interface except when considering the independent molecules.
IFT between the aqueous phase and the organic phase of asphaltenes has been studied by many researchers to illuminate the adsorption behavior of asphaltenes at the interface. Aging time effect, asphaltene concentration, solvent type effect, PH value of aqueous phase, salinity of aqueous phase, temperature and pressure are the most common factors in terms of asphaltene IFT studies [12, 15-21].
With increasing aging time, more asphaltene molecules will be adsorbed to the oil/water interface leading to a drop of the IFT value. Due to the large molecular weight and less surface-active property compared with surfactants, it is much more difficult for asphaltenes to reach the stable state during the adsorption to the interface, with the time to reach equilibrium state as long as few hours [15-17]. From the studies of aging time, it was revealed that adsorption of asphaltene molecules to the interface was a slow process compared with surfactant and followed by long time reconfiguration afterwards. Additionally, the equilibrium IFT can be measured by conducting the dynamic IFT measurement in a long aging time by the pendant drop shape method. When the curve of dynamic IFT versus time showed a plateau trend, the value of equilibrium IFT was empirically obtained. However, in most cases, it was hard to define when the equilibrium IFT was reached as in long-term the IFT still decreased yet extremely slowly with the aging time. Even though the equilibrium IFT was broadly studied and used in the asphaltenes, there was still lack of specific reported method regarding defining equilibrium IFT of asphaltene system.
The relationship between asphaltene concentration and IFT is also worthful to be investigated in the interfacial property studies of asphaltenes. Briefly, equilibrium IFT decreases drastically when the asphaltene concentration increase in a relatively low concentration range and then starts to reach a plateau at high asphaltene concentration. By plotting equilibrium IFT versus asphaltene concentration, CMC was obtained and surface excess concentration was fitted during the previous studies [12]. However, CMC is not accurate to describe aggregation behaviors of large molecular weight molecules aforementioned. As a consequence, the main achievement to investigate IFT versus asphaltene concentration is to imply the amount of adsorbed asphaltenes to the interface with the changing of concentration. Surface pressure, which could be obtained by the method that the bare IFT minus IFT in real-time, is an important indicator to quantify the surface concentration of adsorbed asphaltenes per area. Maximum surface excess concentration of asphaltenes can be further calculated by Gibbs adsorption equation.
As the ratio of aromatic to alkane components varies from different sources of crude oil, it is significant to mimic polarity effect of the organic phase by using good and poor solvents in the laboratory environment. After asphaltenes diluted by the organic solvent, the IFT is correlated with solvent type by showing an increasing trend at higher volume percent of heptane [18]. At higher asphaltene concentration, the equilibrium IFT is easier to reach for good solvent like toluene so the adsorption time is short, while in the case of poor solvent like pentane the equilibrium process is slower. Except the adsorption time, the surface excess concentration of asphaltenes with the effect of polarity of solvent if of significant meaning if it is associated with emulsion stability. The emulsion stability has been reported that with the increasing heptane volume percentage the stability increases at first, then reaches a peak, and finally decreases. However, in terms of IFT studies on solvent effect, the most common studies focus on the equilibrium IFT or dynamic IFT, while the meaning behind the specific IFT values and adsorption kinetics are still lack of investigation.
Due to the basic and acid groups of asphaltene molecules, different PH value of the aqueous phase can change the interfacial behavior of asphaltene or crude oil system at the interface. In general, at neutral PH, the crude oil or asphaltene system has the highest IFT compared with that at low PH or high PH value as the acidity or alkalinity of the aqueous phase would induce the adsorption of asphaltene molecules to the interface. If the asphaltenes contain more acidic groups than basic groups, the lowest IFT will be observed at high PH range [19, 20]. On the other hand, there will be lowest IFT values at low PH range if the asphaltenes have more basic groups than acidic groups. Actually, the IFT results of PH effect are coincident with those of emulsion stability which also indicates higher stability at low and high PH value rather than neutral PH value.
Monovalent and divalent salts are the main components of the sea water which are often encountered in the aqueous phase in the industry. Compare with divalent salt, monovalent salt has been widely investigated. With increasing concentration of KCl, the IFT of crude oil system was found to decrease slightly within a low-salinity range and increase afterwards, which was proved by the fact that existence of KCl would affect the oil recovery [21]. In the experiments conducted by Bai [22], with increasing sodium chloride concentration, the IFT of both asphaltene and crude oil system increased. However, regarding the divalent ions, the equilibrium IFT versus divalent concentration such as calcium ions and magnesium ions has been reported, while the effect of anion on the IFT is still lack of investigation.
It is meaningful to study adsorption kinetics of asphaltenes at the oil/water interface at elevated temperatures since high temperature water is used in the extraction process of oil sands industry. However, the results of temperature effect on the IFT are still under controversy. One study found that there was no significant influence on adsorption in the range of 5 ℃ to 45 ℃ for asphaltenes extracted from Brazilian crude oils [24]. H.W. Yarranton et al. [25] observed that IFT and elastic modulus at the oil/water interface showed little relevance with temperature varying from 23 ℃ to 60 ℃. Another study showed that IFT decreased with increasing temperature from room temperature to 125 ℃, proving higher temperature did lead to a larger decrease of IFT. Our studies on the IFT will help to deal with the controversy and fulfill the vacancy of adsorption kinetics of asphaltenes under different temperature.
In the real industry, pressure is another key indicator during the oil recovery procedure. In the primary stage, the pressure of natural reservoir is the driving force and then followed by water injection into reservoir leading to a higher pressure in the second recovery. Moeini et al. [26] have discovered that an increasing tendency of equilibrium IFT versus pressure appeared due to the enhanced intermolecular interactions of the two immiscible phases. Barati-Harooni [27] got similar results in their own studies.
It has been widely accepted that interfacial rheology is correlated with emulsion stability which is a powerful tool in the interfacial studies. Interfacial rheology is generally defined as the relationship between IFT and deformation of the interface as a function of time [28]. Interfacial rheological properties of asphaltenes describing the expansion and compression processes simulate the deformation behaviors happened during the droplets coalescence in the real cases of emulsions. Dilatational and shear deformation are the two main types of deformations of interfacial rheology. 1) To the dilatational deformation, the shape of the interface is constant and the interfacial area will increase or decrease with the oscillation. 2) To the shear deformation, the interfacial area is unchanged while the shape of the interface is altered. The reorganization or interactions of adsorbed asphaltene molecules at the interface can be indicated through interfacial dilatational rheology studies at various experimental studies. Effects of aging time, frequency of the harmonic oscillation, asphaltene concentration, PH value of the aqueous phase, salinity of the aqueous phase, solvent type of the organic phase, temperature and pressure on the interfacial dilatational rheology studies have been reported by many researchers.
The evolution of the two components of interfacial elasticity (elastic modulus and viscous modulus) will provide information on the reconfiguration and interaction between adsorbed asphaltene molecules. It was indicated that enhancement of elastic modulus and viscous modulus was observed with the increasing aging time and a plateau was reached at the end of the experiments. The studies on the aging time elucidated that there was a continuous changing on the configuration of asphaltene molecules which might include the intermolecular cross-linking and aggregation at the oil/water interface.
At low frequency, the expansion process makes a newly generated interface to be contacted with the bulk solution by adequate time allowing asphaltene molecules to diffuse to the interface. Thereby, the diffusion of asphaltene molecules reduces the variation of IFT as a function of time and further decreases elastic modulus. However, at high frequency, the diffusion of asphaltene molecules during the oscillation can be neglected so that elastic modulus is approximately equal to instantaneous modulus. In conclude, the measured elastic modulus is enhanced by elevated frequency and the plateau finally appeared [29].
Diffusion process during the oscillation process is also affected by the asphaltene concentration. At low asphaltene concentration, the diffusion of asphaltene molecules is negligible so that the elastic modulus of the interface increases with asphaltene concentration at this range. Nevertheless, at higher asphaltene concentrations, the diffusion of asphaltene molecules during the harmonic oscillation starts to impact the results of interfacial dilatational rheology. Thus, with increasing asphaltene concentration, the elastic modulus was found to increase first and then decrease by reaching a peak at the concentration of 100 mg/L to 200 mg/L. LVDT model was used to fit the curves of elastic modulus versus asphaltene concentration when the interface was generated and stabilized in a short time (~ 10 mins) [30]. However, the LVDT model was invalid to fit the data of elastic modulus if the generated asphaltene interface was aged for a longer time as this model did not count for the interaction or reconfiguration of adsorbed asphaltene molecules.
The results of PH effect on the interfacial rheology have been presented corresponding to the results of emulsion stability [31]. Compared to neutralized PH value, a slight increase of elastic and viscous modulus was obtained at PH 2. If the PH is above 8, interfacial rheology increased drastically with increasing PH value. To the PH value effect, the results of interfacial rheology are consistent with those of IFT value and emulsion stability.
Considering interfacial rheology studies of the salt effect, sodium chloride effect on the oil/water system was published by Alves et al. [32], which showed that both elastic and viscous modulus of interfacial elasticity were enhanced at all times with the increasement of sodium chloride in the aqueous phase. However, as one of the main salts in the aqueous phase, there are no studies on calcium chloride effect on the interfacial rheology as well as emulsion stability of independent asphaltenes system.
Yarranton et al. [25] studied the effect of asphaltene concentration in different solvents by changing the volume percentage of heptane in the mixture of heptol. In their results, it can be observed that both of the elastic and viscous modulus increased as the heptane fraction increased. The interfacial rheology results indicated that a more rigid film was formed in a poor solvent as the cross-linking or reconfiguration of asphaltene molecules was strengthened. Interfacial dilatational rheology results were consistent with the emulsion stability results which showed that the emulsion stability increased as the heptane added into the toluene solution and reached a peak roughly around 50/50 heptol. However, it is still difficult to declare that the interfacial rheological properties are totally consistent with the phenomenon of emulsion stability under different ratio of heptol. When the heptane fraction is higher than 50%, emulsion stability is decreased with the increasing volume percent of heptane, while the elastic and viscous modulus varying with the volume percentage of heptane fraction higher than 50% are still unrevealed in their studies. Narve et al. [33] measured the interfacial elasticity for low asphaltene concentration and found that at higher volume percentage of heptane the value of interfacial elasticity was higher, which was contradicted with the emulsion stability results as mentioned. So systematical investigation is still needed associating the interfacial rheological studies with emulsion stability.
The objective of this thesis is to investigate the adsorption kinetics as well as interfacial behaviors of asphaltenes by associating the IFT and modulus with emulsion stability under the conditions of different temperature and calcium chloride concentration. This thesis reviewed the previous studies on the IFT and interfacial dilatational rheology of asphaltenes. The vacancy of this field was also pointed out in order to improve the understanding of interfacial properties of asphaltenes. Therefore, the research in this thesis focused on adsorption kinetics the effect of temperature and calcium chloride which are commonly encountered in the industry. Pendant drop shape method was used to achieve the accomplishment of this study. The effect of calcium chloride was studied by combining dynamic IFT, interfacial dilatational rheology, compressibility studies and emulsion stability which showed that how increasing calcium chloride concentration led to stabilized emulsions. In addition, this research provides a systematical procedure to study interfacial properties of asphaltenes and provide practical analysis model to set up the relationship between interfacial properties and emulsion stability. Our results provide useful information regarding the adsorption kinetics and adsorption mechanism of asphaltenes at the oil/water interface, with implication on enhancing oil recovery and waste disposal production.
Chapter one introduces the background information of asphaltene aggregation, structure and molecular weight as well as challenging problems caused by asphaltenes. In this chapter, the current investigation regarding IFT, interfacial dilatational rheology and emulsion stability was also reviewed.
Chapter two introduces the techniques used to investigate the interfacial properties of asphaltenes under different conditions.
Chapter three investigates the effects of asphaltene concentration and temperature on the dynamic IFT of oil/water interface using pendant drop shape method. The adsorption process showed three stages as a function of adsorption time, known as Regime I (diffusion-controlled regime), intermediate Transition Regime (nondiffusion-controlled regime) and Regime II (saturation regime).
Chapter four illustrates the effect of calcium chloride concentration on the IFT and interfacial dilatational rheology which was further proved by emulsion stability experiments. It was found that dynamic IFT and interfacial dilatational rheology increased with the increasing calcium chloride concentration. Results of interfacial dilatational rheology and compressibility studies elucidated that calcium chloride induced the rearrangement of asphaltene molecules and formed a more rigid film at the interface. By combining the analysis of IFT and interfacial dilatational rheology, it was proposed that calcium chloride contributed to the stability of water-in-oil emulsions.
Chapter five summarizes the major conclusions of our studies throwing lights on the temperature and calcium chloride effects on the interfacial properties of asphaltenes. The future works on the interfacial properties of asphaltenes are also suggested including adsorption kinetics with other factors like heptol, PH, temperature, pressure, cation and anion.
Chapter 2 Experimental Techniques
The size of asphaltenes in toluene was analyzed by the Zetasizer Nano ZS (Malvern Instruments, UK) by employing a dynamic light scattering technique as shown in Figure 2.1. The Zetasizer Nano Zs integrates three different techniques in a compacted equipment which saves space and performs better in efficiency. This apparatus is of great performance with two size analyzer which has higher sensitivity to detect aggregates, small particles and diluted samples ranging from low to high concentration as it uses Non-Invasive Backscatter optics (NIBS) instead of 90 degree scattering optics. The NIBS technology lightens a large number of particles through an effective fiber detection, which leads to a smaller number fluctuations and larger size of maximum measured particles. Other benefits of using Zetasizer include available grade results, data quality report demonstrating the reliability of results and possibility to measure high condensed samples with little or even no dilution. Except the dynamic light scattering for particle size, there is also a zeta analyzer to test zeta potential by electrophoretic light scattering, and a molecular weight analyzer through static light scattering inside the Zetasizer. The equipment with various accessories and options is able to measure a wide range of samples and to control temperature with great accuracy. The measurement range of diameter for particle and molecular size is 0.3nm – 10.0 µm with minimum sample volume of 12 µL. The asphaltene in toluene solution was loaded in a square glass cuvette with square aperture and cap. The cap was used to seal the glass cuvette to prevent evaporation of the organic solvent.
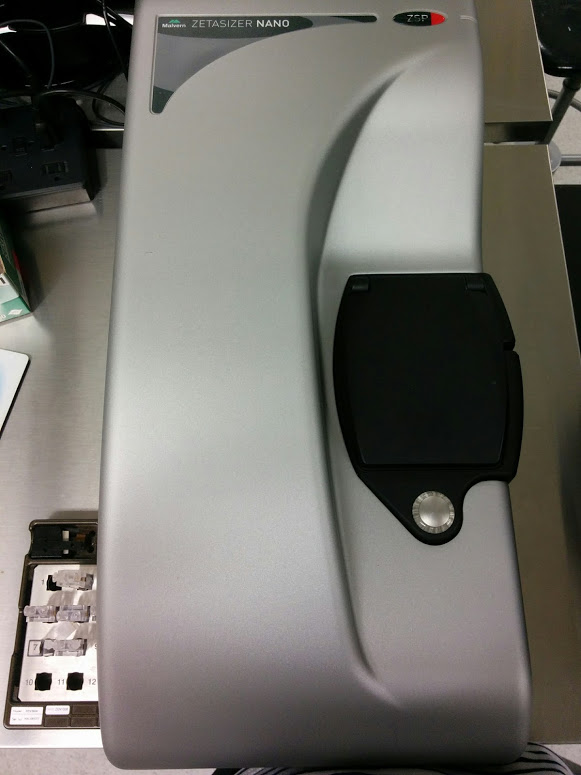
Figure 2.1Zetasizer Nano ZS by Malvern Instruments, UK
2.2 Dynamic Light Scattering (DLS)
DLS, known as photon correlation spectroscopy (PCS), is a technique which is commonly utilized to test particle or molecular size and it is a powerful tool to monitor the aggregation behaviors and colloid nature of asphaltenes or other fractions in crude oil in real-time [1]. Figure 2.2 displays scheme of the optical arrangement to this equipment. With this technique, the diffusion coefficient of particles suspended in the viscous bulk solution can be measured, which is able to be further converted to size and size distribution as shown in Stokes-Einstein equation. The principle of DLS can be briefly interpreted as the constant Brownian motion dominating the diffusion coefficient of particles. The diffusion is related to the particle size and temperature; i.e. smaller particles diffuse faster compared with larger particles, particles diffuse faster at higher temperatures than lower temperatures. However, it is still challenging for the case of asphaltenes at higher concentrations as the solution will become almost nontransparent for the laser to illuminate.
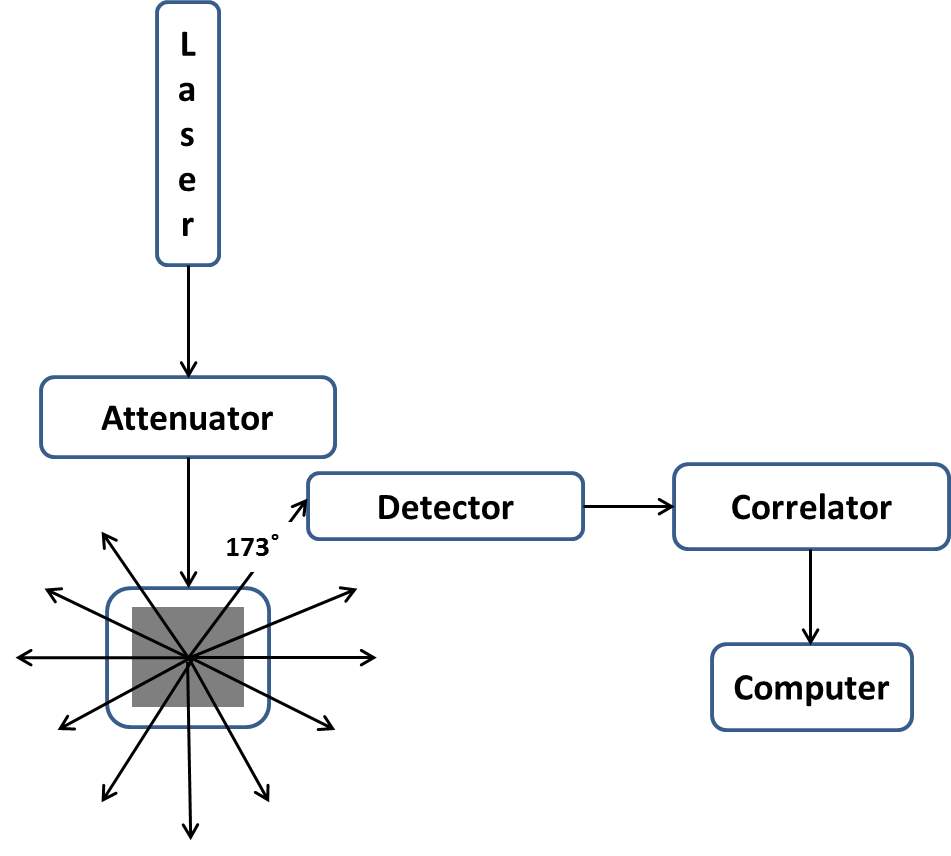
Figure 2.2Scheme of optical arrangement of the equipment [2].
2.2.2 Principle of Dynamic Light Scattering
DLS is a commonly used tool to measure the size of colloidal particles and macromolecules in a suspension system. The phenomenon of Brownian motion results in fluctuation which will further lead to inhomogeneities of the refractive index. Heterodyning and homodyning are the two main techniques to measure the dynamic correlation function. To the heterodyning technique, static field and scattered field are attached together at the photodetector which is more suitable for small intensities. At the incident wavelength, a static light source and a scattered light are applied consistently. To the homodyning technique, it is more appropriate for intense scattering like colloidal particles and only scattered light is received by the photodetector. In the homodyne regime, the diffusion coefficient D is related to the time dependent decay rate τc, shown as [3]:
 (2.1)
(2.1)
where k means the wave number of scattered light, which is calculated by the following equation:
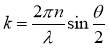 (2.2)
(2.2)
where n means the refractive index of the solvent, λ stands for the wavelength of the incident light at the photodetector, θ is the scattering angle. In general, the equations (2.1) and (2.2) are suitable for particles without interactions. For the case of asphaltene molecules, the interactions do exist in the system. However, considering that the time needed for aggregation kinetics of the asphaltenes is much longer than the measurement time, the equations (2.1) and (2.2) are still valid to investigate the diffusion coefficient of asphaltenes in the bulk solution. Then the hydrodynamic radius of the particles can be calculated by the Stokes-Einstein equation listed as equation (2.3):
 (2.3)
(2.3)
where kB is the Boltzmann constant, T is the Kelvin temperature, η is the viscosity of the solvent and R is the hydrodynamic radius of the particles.
2.3 Contact Angle Goniometer and Tensiometer
The contact angle goniometer and tensiometer used during our studies is produced by Ramé-hart Instrument Company as shown in Figure 2.3. This instrument measures static and dynamic (advancing and receding) contact angle, surface tension, and IFT, interfacial dilatation rheology, etc.
A software named as DROPimage in a personal computer calculates the IFT through a standard procedure. The program is based on the principle of Young-Laplace equation and is able to process the cases of pendant and inverted pendant droplets.
This apparatus consists of several parts, an optical bench, a glass syringe, a champer for high temperature measurements, a camera and a quartz cell. The aqueous phase was loaded in a transparent quartz cell with the internal volume of 45 mL. To control the volume of converted pendant drop precisely, the automated dispensing system was used in conjunction with the oscillator providing periodic oscillation or specific static droplet volume when the interfacial dilatational rheology or dynamic IFT was tested respectively. The automated dispensing system was controlled by software to generate a droplet. This hydraulic system includes a 250 µL syringe, a pump, serial cables, software and stage adapters. The oscillator could provide the oscillation frequency between 0 and 25 Hz. A high speed digital camera was used to achieve the demanding to capture the pictures in real-time with adequate power and extra memory storage. The camera was connected to a personal computer. The microsyringe fixture was an accessory to hold the glass syringe where the organic phase was loaded. To prevent the glass syringe from swinging, the fixture facility was designed to allow the same working location for the subsequent operation for droplets. An environmental chamber in conjunction with a proportional temperature controller was used to control the experiment temperature.
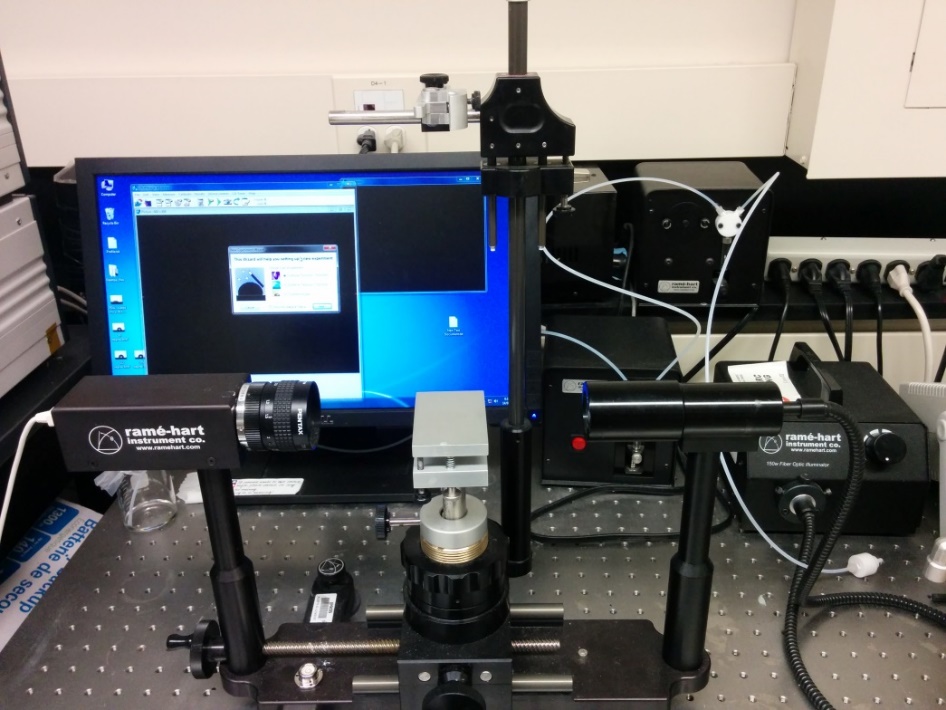
Figure 2.3Contact angle goniometer and tensiometer used by Ramé-hart Instrument Company.
IFT can be measured by many methods according to the Young-Laplace equation. The primary methods of measurement include capillary rise method, maximum bubble pressure method, Wilhelmy plate method, Du Noüy ring method, drop weight method and drop shape method. Among all the techniques, pendant drop shape method is one of the most powerful and adaptable tools. Sessile and pendant drop methods are the two primary methods for the drop shape methods, which are both commonly utilized to investigate liquids with high viscosity and aging effect. However, this method might fail to measure IFT accurately if the drop shape is not in Laplacian shape. In this thesis, the dynamic IFT was tested based on the pendant drop shape method. The outline of drop shape was captured by a charge-coupled device (CCD) camera in real-time. The obtained shape was then further fitted to Laplace shape to calculate IFT.
About a century ago, Worthington [4] initially proposed a method to determine the IFT according to the deformed shape of a liquid drop under the effect of gravity. Another classic method by Bashforth and Adams [5] which is still valid in use today showed modified solutions to axisymmetric Young-Laplace equation by comprehensive numerical tables. Andreas et al. [6] created a new simple approach to quantify the accuracy of the pendant drop shape method by obtaining the ratio of drop diameter to maximum drop diameter. Later studies improved the work of Andreas by integrating the Young-Laplace equation. Jennings et al. [7] modified the Gauss-Newton method decreasing the requirement of calculation time significantly. Another alternative for optimization method is the Levenberg-Marquardt algorithm [8] by combining the Gauss-Newton method and the convergence of steepest descent. To calculate IFT from the profile of droplet, Dingle et al. [9] used the Galerkin finite element method to achieve the precision of fitting. According to more recent studies, Berry et al. [10] proposed a new criterion to estimate the precision during the experiment which was the Worthington number (Wo). When Wo approximately equals to 1, the obtained surface tension or IFT can be considered as accurate. However, a relatively smaller drop volume leading to a smaller Wo less than 1 will result in an inaccurate value of surface tension or IFT.
2.4.2 Theory
The principle of drop shape method is based on the balance of gravity forces and interfacial forces, which could be explicated as IFT contributes to the spherical shape of droplet while gravity forces elongate the droplet. One of the simple methods is introduced as follows. Two parameters are empirically defined as the diameter d at the top of the drop and the equatorial diameter D. The equation to calculate IFT was listed as:
 (2.4)
(2.4)
where γ is the IFT, Δρ is the density difference between the two immiscible phase, g is the gravity acceleration, D is the equatorial diameter and H is the shape dependent parameter. H is determined by the shape factor (S = d/D). The relationship between H and S can be found in the reference [11] or defined by the following equation:
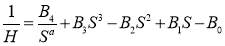 (2.5)
(2.5)
where Bi (i = 0~4) and a are constants for S in a specific range empirically. The table showing the empirical constant for equation (2.5) can also be found in the reference [12, 13].
Chapter 3 Adsorption Kinetics of Asphaltenes at Oil/ Water Interface: Effects of Concentration and Temperature
As one of the most problematic components in crude oil or oil products, asphaltenes have attracted much research interest in petroleum industry [1]. Asphaltenes are conventionally defined as a solubility class that is soluble in aromatic solvents (e.g. toluene), but insoluble in light n-alkanes (e.g. n-heptane). Asphaltenes are the heaviest and polar components consisting of aromatic hydrocarbon rings with peripheral aliphatic chains, containing heteroatoms such as N, O and S as well as metal elements such as V, Ni and Fe [2-3]. According to Yen-Mullins model, asphaltene molecules comprise polyaromatic cores (consisting of an average number of six fused rings) and aliphatic chains. Several asphaltene molecules may stack to form nanoaggregates on condition that asphaltene concentration passes the critical nanoaggregation concentration (CNAC) due to intermolecular interactions such as the π- π interaction. Asphaltene nanoaggregates can further form clusters when the asphaltene concentration is higher than the critical clustering concentration (CCC) [4].
In the oil industry, the formation of water-in-oil emulsion is highly unavoidable and undesirable in the transporting pipelines and downstream refinery equipment [5]. Emulsified water carrying dissolved salts contributes to serious corrosion problems and has a negative influence on the quality of oil products. Asphaltenes are believed to play a crucial role in the stability of the water-in-oil emulsion system. It has been reported that the irreversible adsorption of asphaltenes significantly stabilizes the water-in-oil emulsions along with other components such as resins [6], mineral particles [7] and solids-like waxes. Asphaltenes are reported to be responsible for the rigid film formed at the oil/water interface [8-10] which can hinder drop contraction [8, 11] and inhibit drop coalescence.
The interfacial properties of oil/water interfaces with asphaltenes are important for many interfacial phenomena in oil production. The adsorption of asphaltenes to oil/water interfaces and interfacial tension (IFT) has received considerable attention. The adsorption time of asphaltenes at the initial stage, when IFT dropped drastically, was reported to decrease from more than 1000 s to ~100 s with increasing the asphaltene concentration [12-13]. Previous studies on the adsorption kinetics of asphaltenes at oil/water interface [14-16] suggest that the adsorption is diffusion controlled in the initial stage (short time regime). However, it has been widely acknowledged that dynamic IFT decreases with aging time (e.g. hours), whereas the long-term adsorption kinetics of asphaltenes still remains unclear. In addition, despite the much effort and considerable progress, there is still no agreement in the literature on the reduction kinetics of the IFT and associated interaction mechanism of asphaltenes [13, 15, 17].
Understanding the influence of temperature on the adsorption kinetics of asphaltenes at oil/water interfaces and the interfacial properties is very important in many industrial operations. For example, in surface mining of oil sands industry, bitumen is extracted using hot water (at 40 – 80 ℃) from oil sands [18]. However, there are only limited studies on the effect of temperature on the interfacial behaviors (e.g. interfacial rheology, interfacial tension) of asphaltenes at oil/water interfaces [19-23]. Yarranton et al. [20] reported that the surface pressure isotherm and modulus (interfacial rheology) of oil/water interface with asphaltenes were not significantly different at 23 ℃ and 60 ℃. It was reported in two other studies [21-22] that IFT values decreased considerably at elevated temperature over a wider range of temperature. These previous studies on the effect of temperature mainly focused on the IFT values or interfacial rheology of oil/water interface with asphaltenes. While no report is available about the temperature effort on the adsorption kinetics of asphaltenes at oil/water interfaces.
In this work, the adsorption kinetics of asphaltenes at oil/water interfaces under elevated temperature has been systematically investigated. Pendant drop shape method was used to obtain the dynamic IFT curves to investigate the influences of concentration and temperature, and dynamic light scattering was also employed to provide complementary information regarding the states of asphaltenes in bulk solutions. Our results provide useful insights into the effects of asphaltene concentration and temperature on the adsorption kinetics and adsorption mechanism at oil/water interfaces, with implications for an improved understanding of the properties of emulsions and oil/water interfaces in oil production.
3.2 Experiment Materials and Methods
3.2.1 Materials.
Throughout the study, Milli-Q water (Millipore deionized with a resistance of ≥ 18.2 MΩ·cm) was used to prepare the aqueous solution. HPLC grade of n-heptane, toluene and methylene chloride were purchased from Fisher Scientific Canada and used as received. NaCl solution was prepared by adding NaCl into Milli-Q water to the desired concentration. High-purity NaCl was obtained from Sigma-Aldrich USA and used as received.
3.2.2 Sample Preparation.
Asphaltenes Extraction.Asphaltenes were extracted from a crude oil sample according to ASTM IP143 procedure [30]. Briefly, n-heptane was used to mix with crude oil sample at n-heptane/crude oil ratio of 30:1 (ml/g) and then the mixture was refluxed under stirring for 1 h. The mixture was placed in a refrigerator and was allowed to cool down for 2.5 h. To obtain the raw asphaltenes, the mixture was filtered first and then extracted with n-heptane for 1 h by using a Soxhlet extractor to remove the n-heptane-soluble components completely. After that, methylene chloride was utilized to extract the asphaltenes from the residual filtrate. The obtained asphaltenes in methylene chloride solution were concentrated and then dried under nitrogen flow. The extracted asphaltenes were carefully sealed and stored in the refrigerator before use.
Solution Preparation. Asphaltenes were initially dissolved in toluene to prepare a 2000 mg/L stock solution. To prepare different concentrations of asphaltene solution, the stock solution was sonicated for 5 min before diluted with toluene to a desired asphaltene concentration. The concentration of asphaltene solution used in this study ranged from 50 mg/L to 2000 mg/L. Before each use, the diluted asphaltene solutions were sonicated for 5 min and degassed for another 5 min to eliminate possible bubbles which might form in the oil droplet at elevated temperature during interfacial tension measurements. Fresh asphaltene solutions were prepared and used in all the experiments.
3.2.3 Interfacial Tension.
The dynamic IFT between oil and brine water was measured by the pendant drop shape method by using a goniometer (Ramé-hart Instrument Company, USA). The brine water used was sodium chloride solution of fixed concentration (i.e., 1 M). During a typical experiment, the oil (asphaltene solution) was loaded into a syringe, which was connected to a U-shaped needle. The U-shaped needle was immerged into a fused quartz cell filled with brine solution. A syringe pump was used to generate asphaltene dropltes (with a controlled volume of 10-20 μL) [24]. IFT was determined by analyzing the drop profile captured by a camera, based on the Young-Laplace equation [25]. IFT data was collected every two seconds for 2 hours.
3.2.4 Dynamic Light Scattering (DLS).
The size of asphaltenes in toluene was measured using a Zetasizer Nano ZSP (Malvern Instruments, UK) by employing a dynamic light scattering technique. The experiments were conducted in 50, 100, 500, 1000 and 2000 mg/L asphaltenes in toluene. The effect of temperature on the size of asphaltenes was also investigated. Each sample was measured right after 5 min sonication. The measurements under each condition were repeated for at least five times with three samples to ensure the reproducibility of data.
3.3.1 Particle Size of Asphaltenes.
DLS was utilized to obtain the hydrodynamic radius of asphaltenes in toluene, which could help understand the behaviors of asphaltenes in the bulk solutions and oil/water interfaces. Figure 1 shows the particle size distribution of asphaltenes under different concentrations at 23 ℃ and under 2000 mg/L at different temperatures. A summary of the average particle size under different concentration and temperature conditions is shown in Table S1 and Table S2 in the Supporting Information.
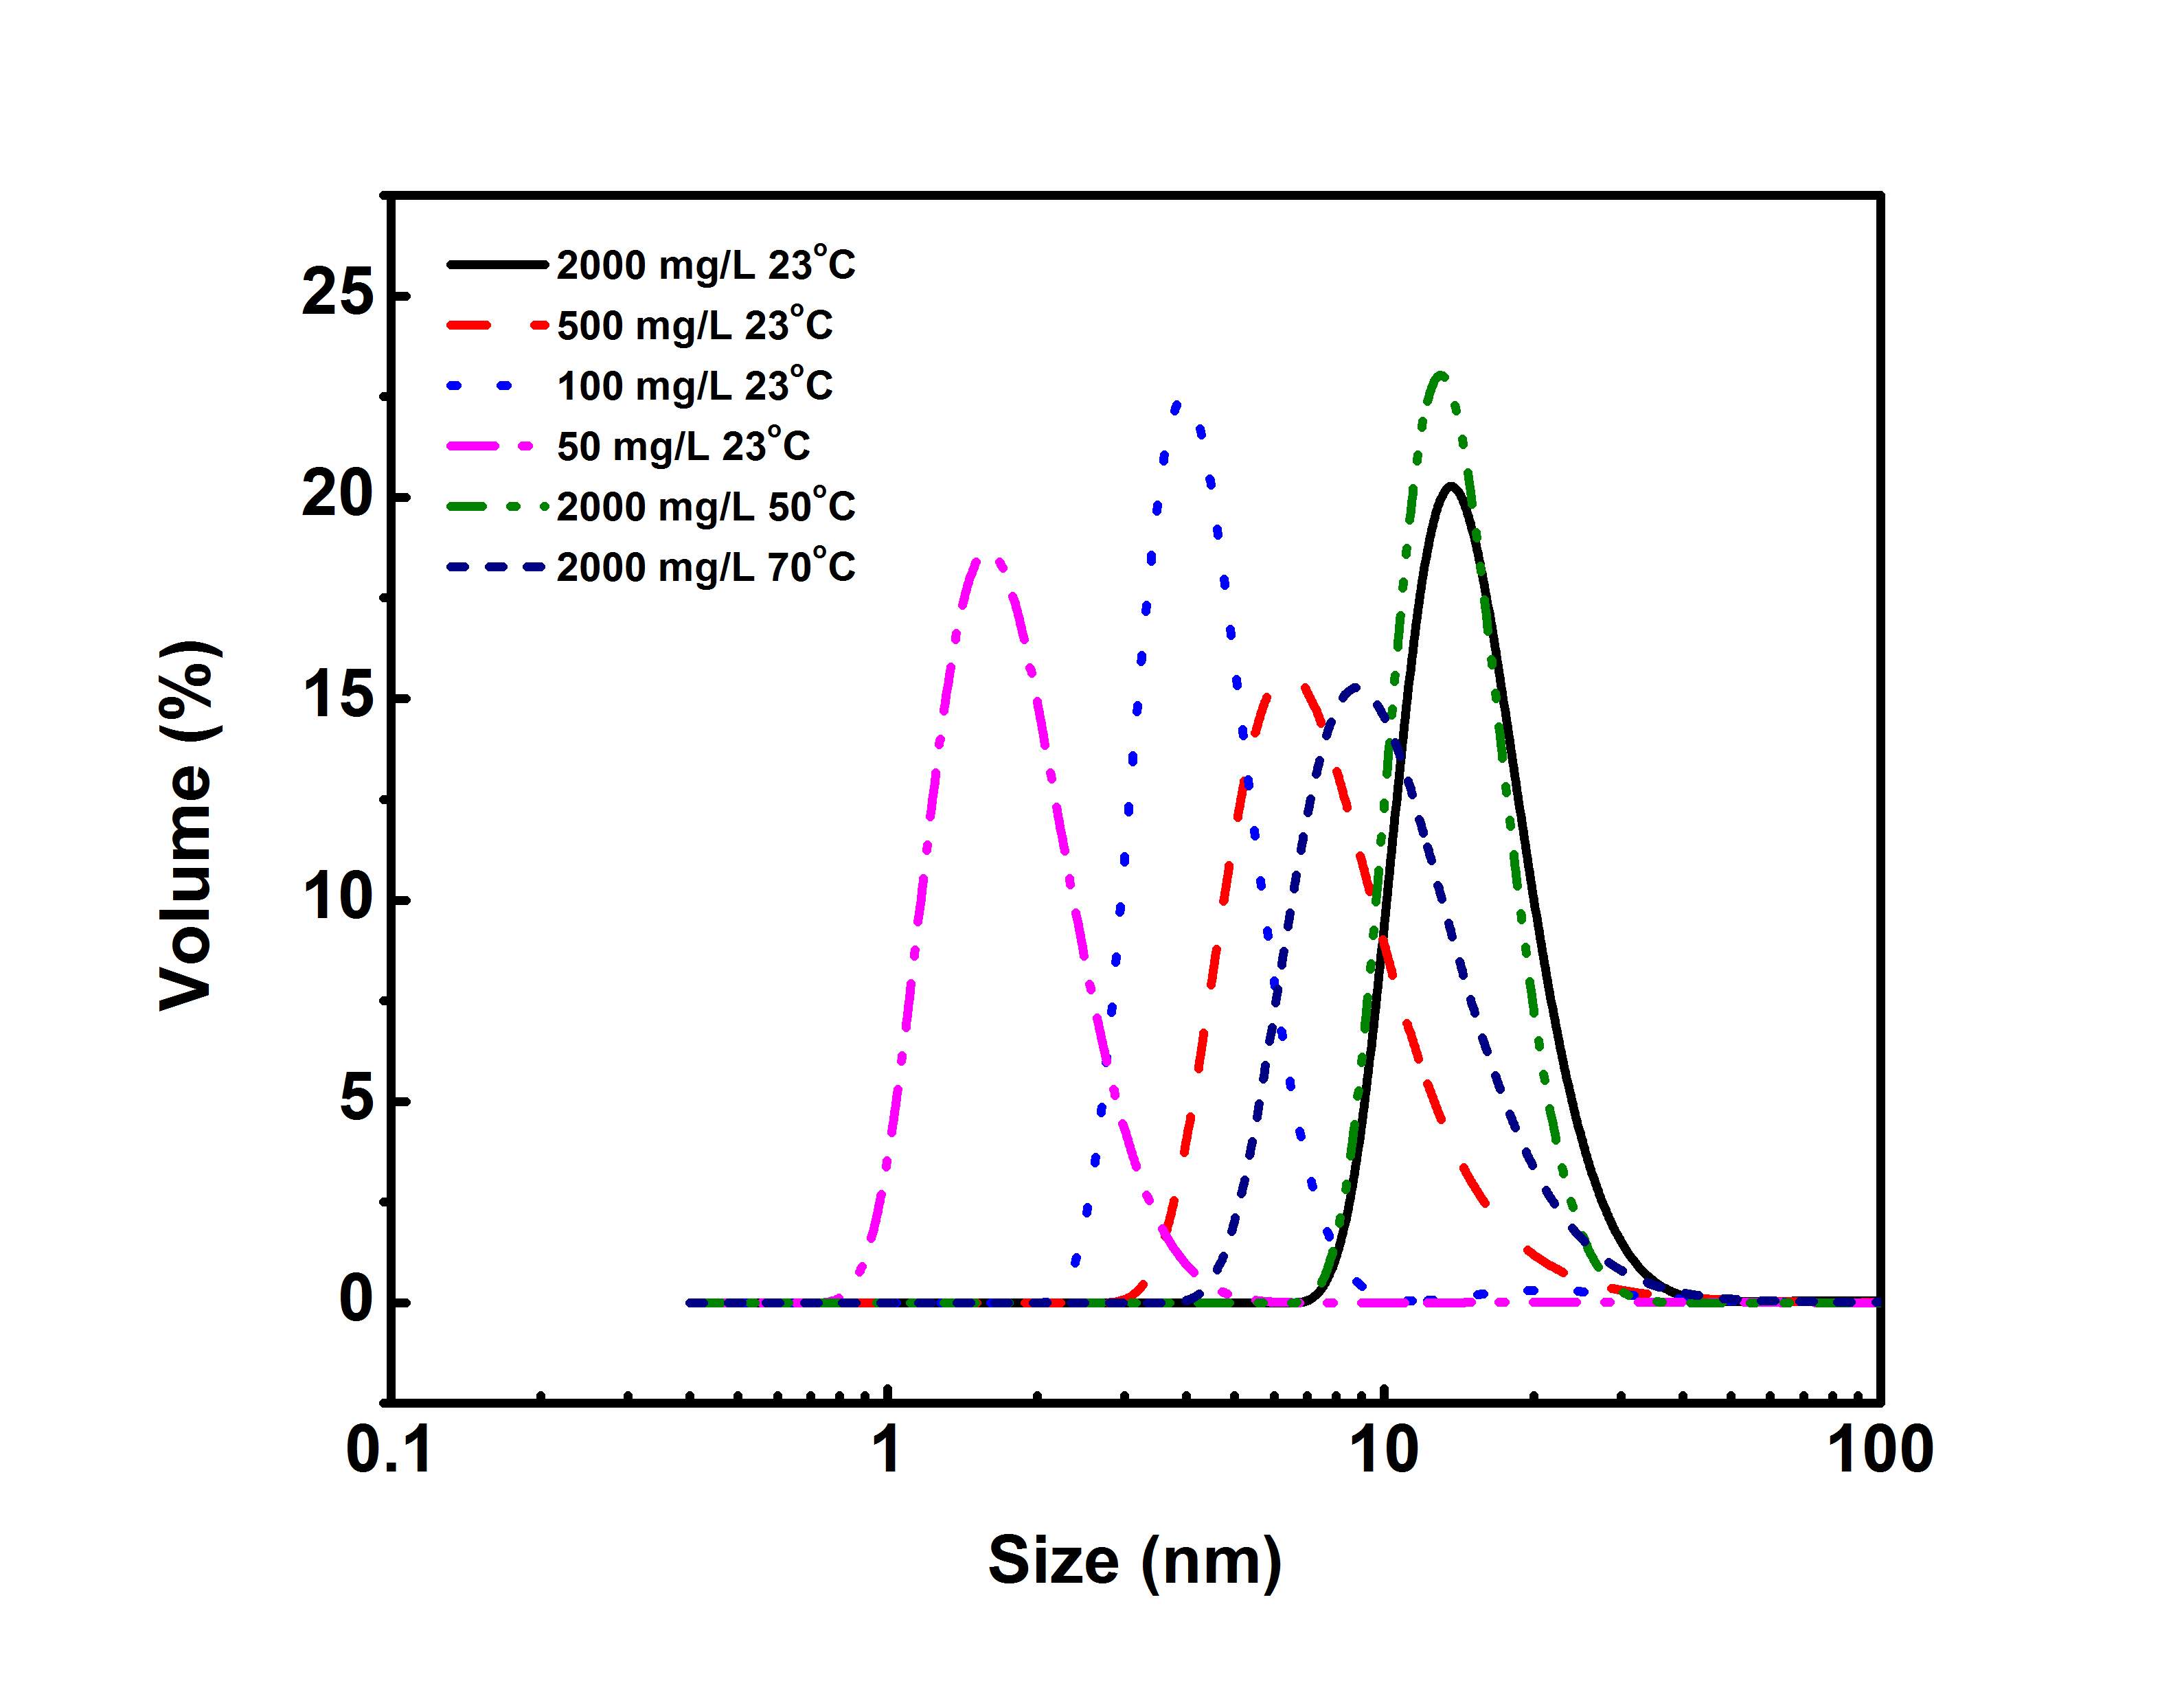
Figure 3.1Size distribution of asphaltene aggregates measured by DLS for asphaltene solutions in toluene of different concentrations (i.e. 50 – 2000 mg/L) at 23 ℃ and 2000 mg/L asphaltenes in toluene solution at 50 ℃ and 70 ℃.
Figure 3.1 shows that the average size of asphaltene aggregates increases with increasing the solution concentration indicating the formation of larger asphaltene aggregates in bulk solutions at higher concentration. Figure 3.1 also shows that the average size of asphaltene aggregates in 2000 mg/L asphaltene solution decreases with increasing temperature from 23 ℃ to 70 ℃. Such effects of asphaltene concentration and temperature on the size of asphaltene aggregates are consistent with the similar trend reported previously [26].
3.3.2 Dynamic Interfacial Tension versus Time.
Figure 3.2 shows the dynamic IFT between NaCl solution and asphaltene-in-toluene solutions at 23 ℃. As shown in Figure 3.2A, under a fixed temperature 23 ℃, the dynamic IFT decreases significantly with time during the first several hundred seconds and then the reduction slows down with time. For all the asphaltene concentrations investigated (50 to 2000 mg/L), the same trend has been observed. It is also found that the IFT decreases as the asphaltene concentration increases, which implies that a growing number of asphaltenes migrate to the oil/water interface under higher concentration condition. Figure 3.2B shows the dynamic IFT between brine water and 100 mg/L asphaltenes in toluene solution at different temperatures (23 to 70 ℃), which indicates that the IFT decreases much faster with time under higher temperatures.
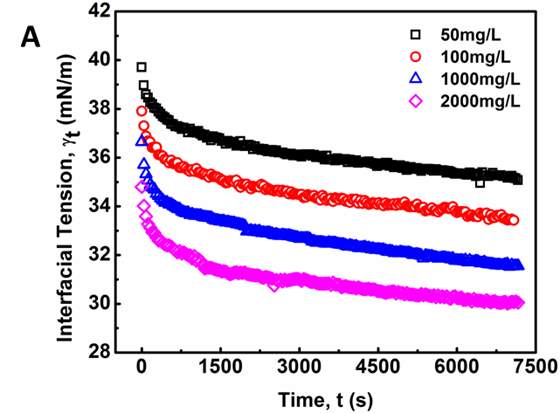
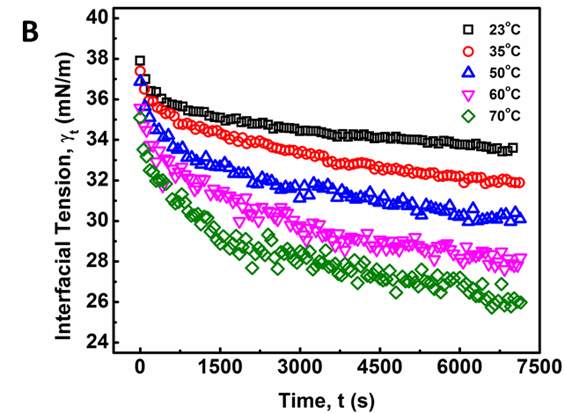
Figure 3.2 Dynamic IFT of asphaltene solutions vs time: (A) for different concentrations (50, 100, 1000 and 2000 mg/L) tested at 23 ℃ and (B) for 100 mg/L asphaltene solution vs time at different temperatures (23 – 70 ℃).
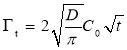
A general trend can be observed for the dynamic IFT curves in Figure 2: (1) initially, the measured IFT decreases drastically with time (i.e., a few hundred seconds), (2) then the reduction becomes less significantly with time, (3) while the IFT still drops very slowly even after 2 h, which indicates that the system did not completely reach the equilibrium state even after 2 h. Such a reduction behavior of the dynamic IFT for oil/water interface with asphaltenes, particularly for the initial stage, is analogous to that of proteins or polymers with large molecular weight at air/water interface of which the adsorption was previously suggested to a diffusion-controlled process [27-29]. The Ward-Tordai equation has been widely used to describe diffusion-controlled processes [16, 27-29] as shown in Equation 1 which is applied to analyze the initial stage of the dynamic IFT data for asphaltenes,
 (3.1)
(3.1)
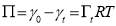
where  is the surface excess concentration of materials (e.g., asphaltenes) on the interface at time t, D is the diffusion coefficient of asphaltenes moving to the interface, and C0 is the asphaltene bulk concentration. According to the literature [14, 30], the surface excess concentration can be correlated to the surface pressure by Equation 3.2, where γ0 and γt are the interfacial tension at t=0 and arbitrary time t, R is the gas constant with the value of 8.314 J/(mol·K), and T is temperature.
 (3.2)
(3.2)
Combining Equations 1 and 2, the Gibbs-Duhem diffusion equation can be obtained as shown in Equation 3.3.
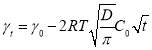 (3.3)
(3.3)
According to Equation 3.3, γt should be proportional to  within the short time for a diffusion-controlled process. Therefore, to better analyze the adsorption kinetics of asphaltenes, Figure 3.2 was replotted as IFT vs. as shown in Figure 3.3.
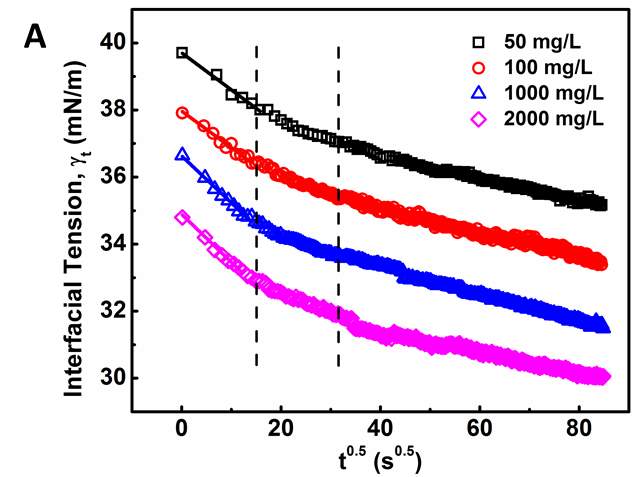
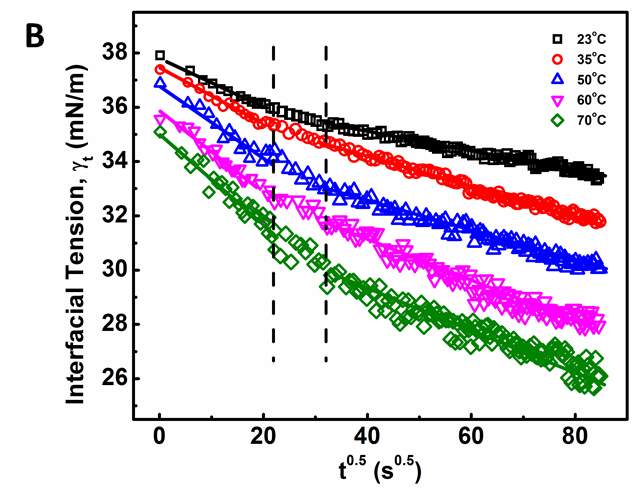
Figure 3.3Dynamic IFT vs. : (A) for 50, 100, 1000 and 2000 mg/L asphaltene solutions in toluene at 23 ℃, and (B) for 100 mg/L asphaltene solution at different temperatures (23 – 70 ℃).
Figure 3.3 clearly shows that the adsorption process of asphaltenes to the oil/water interface can be divided into three stages as illustrated by the dash lines, denoted as Regime Ι, Regime II and Regime III, respectively. Regime I is the initial stage which shows the sharpest reduction of IFT with time. Regime III is the stage at relatively long time that gradually approaches adsorption equilibrium. Regime II is the transition stage between Regimes I and III.
Regime I. During the initial stage of adsorption (Regime I), Figures 3.3A and 3.3B clearly show a linear correlation between IFT and  , which agrees with the Ward-Tordai model (Equation 3.1) and the Gibbs-Duhem diffusion equation (Equation 3.3). This behavior is similar to the adsorption behavior of proteins or polymers to air-liquid interface or liquid-liquid interface [27-29, 31-32]. These results indicate that the adsorption process during Regime I is controlled by the diffusion of asphaltenes to the oil/water interface. Figure 3.3B further shows that such a diffusion-controlled regime is much more noticeable for asphaltenes solutions at higher temperatures.
Based on Equation 3.3 and Figure 3.3, the slopes (and diffusion coefficients) and γ0 can be directly obtained from the linear fitting of the IFT data in Regime I, which are summarised in Table S3 in the Supporting Information for conditions of different asphaltene concentrations and temperatures. Table S3 shows that the absolute value of the slope increases with increasing the asphaltene concentration or increasing the temperature (for fixed asphaltene concentration, i.e., 100 mg/L). The diffusion coefficient D is related to the absolute value of the slope k in Regime I of Figure 3.3 by Equation 3.4. The diffusion coefficient under different asphaltene concentrations and temperature conditions are displayed in Figure 4 and Table S4.
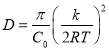 (3.4)
(3.4)
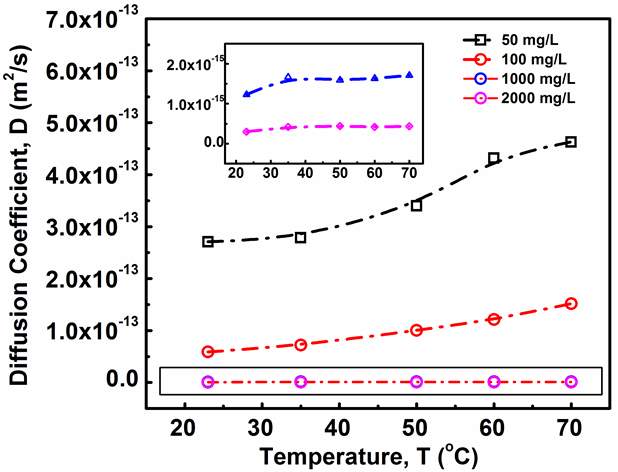
Figure 3.4Diffusion coefficient vs. temperature under different asphaltene concentration conditions (i.e., 50, 100, 1000 and 2000 mg/L). Inset highlights the diffusion coefficient results for the cases of 1000 and 2000 mg/L asphaltenes.
Figure 3.4 shows that the diffusion coefficient of asphaltenes to the oil/water interface becomes larger with increasing the temperature for all asphaltene concentrations investigated. While under a fixed temperature, increasing asphaltene concentration leads to a lower diffusion coefficient. It is clear from Figure 3.4 that the asphaltene concentration has a more significant influence on the diffusion coefficient, as compared to temperature. Meanwhile, the influence of temperature on the diffusion coefficient appears to be more pronounced for lower asphaltene concentration conditions. Specifically, when the temperature increases from 23 ℃ to 75 ℃, the diffusion coefficient for the 50 mg/L asphaltene case increases from 2.71
×10-13 to 4.63
×10-13 by 1.92
×10-13 m2/s; while for the 2000 mg/L asphaltene case, it increases from 2.99
×10-16 to 4.34
×10-16 by only 1.36
×10-16 m2/s.
The results (Figure 3.4) demonstrate that asphaltenes diffuse faster to oil/water interface at lower asphaltene concentration and at higher temperature, which might be affected by two factors: (1) particle sizes of the asphaltenes under different concentration and temperature conditions, and (2) the energy barrier under different conditions during the diffusion-controlled regime. DLS measurements (Figure 3.1) showed that the hydrodynamic radius of asphaltenes increases with increasing the asphaltene concentration or with lowering the temperature. Therefore, the results in Figure 3.4 agree with the trend on changes of diffusion coefficient as predicted by the Stokes-Einstein equation, that the diffusion coefficient decreases with increasing the particle size.
However, it should be noted there some fundamental difference between the bulk diffusion coefficient, Db, predicated by the Stokes-Einstein equation and the interfacial diffusion coefficient determined in this work. Quantitatively, for instance, the bulk diffusion coefficient, Db, for 50 mg/L asphaltene solution at 23 ℃ is calculated as 6.99
×10-11 m2/s according to the Stokes-Einstein equation. In contrast, the interfacial diffusion coefficient, D, was determined to be 2.71
×10-13 m2/s (Figure 3.4), which is about two orders of magnitude smaller than Db. For another case of high concentration and high temperature (e.g., 2000 mg/L asphaltene solution at 70 ℃), the average size of asphaltenes is ~11.2 nm (Figure 1), and the bulk diffusion coefficient Db can be estimated to be 6.42
×10-14 m2/s using the Stokes-Einstein equation. However, the interfacial diffusion coefficient D base on Ward-Tordai equation is 4.34
×10-16 m2/s (Figure 3.4), which is also about two orders of magnitude smaller than Db. The obvious difference of the theoretically calculated bulk diffusion coefficient Db and the experimentally determined interfacial diffusion coefficient is most likely caused by two factors: (1) the Stokes-Einstein equation considered the bulk diffusion of hard spheres, while asphaltenes and asphaltene nanoaggregates in good solvent toluene never behave as hard spheres; (2) additional energy barrier would be required for asphaltenes to diffuse to oil/water interface as compared their bulk diffusion in good solvent toluene, which plays a vital role during the diffusion-controlled process as reported by Ward [33].
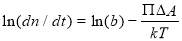
The analysis of the adsorption kinetics at Regime I can provide useful information regarding the energy barrier of asphaltene adsorption to oil/water interface. The adsorption model of Ward and Tordai [33] proposed that an energy barrier for interfacial adsorption exists due to the compression of the interface to create an area ΔA for the new interface-active materials (asphaltenes here) to diffuse and move into the interface. In this work, this energy barrier for interfacial diffusion is mainly due to the compression of the oil/water interface due to the diffusion of asphaltenes [28, 34]. The adsorption rate is then given by Equation 5, [33]
 (3.5)
(3.5)
where n is the surface excess, b is a constant parameter that includes kinetics pre-factors (including the subsurface concentration), Π is the surface pressure ( ), ΔA is the area for asphaltenes to move in, k is the Boltzmann constant and T is the temperature. In the limit of low surface coverage, dn/dΠ is constant during the short-term adsorption as the interactions between adsorbed asphaltenes are neglected and the regime is diffusion controlled. Thus dn/dt can be replaced by dΠ/dt and equation (3.5) is able to be rewritten as Equation 3.6. Here, ln (dΠ/dt) is proportional to γ when the adsorption rate is limited by the adsorption energy barrier.
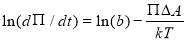 (3.6)
(3.6)
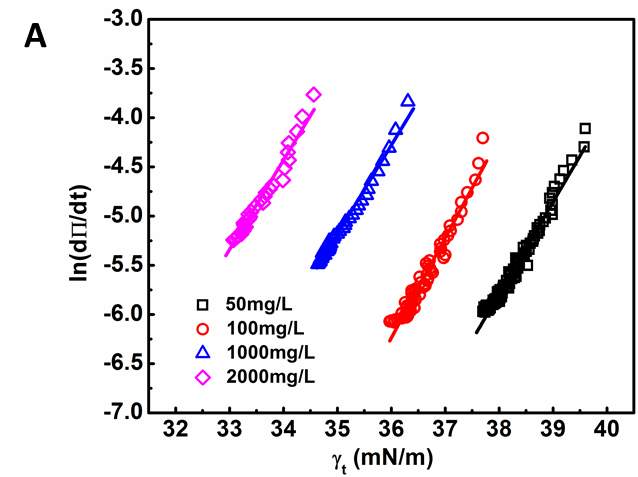
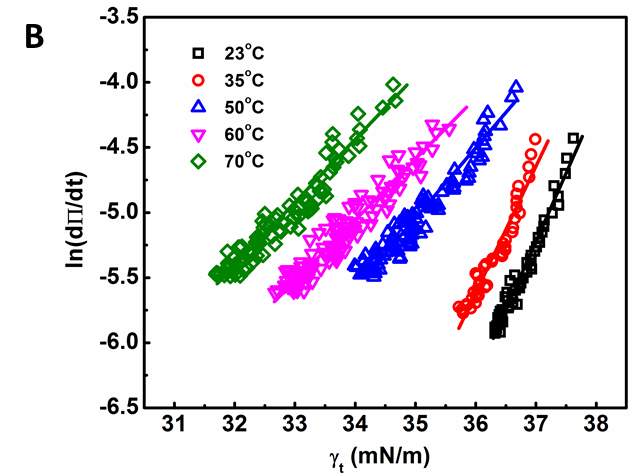
Figure 3.5 Short-term IFT in Regime I replotted by ln(dΠ/dt) vs. IFT using Equation (6). (A) 50, 100, 1000 and 2000 mg/L asphaltene solutions at 23 ℃. (B) 100 mg/L asphaltene solution at different temperatures (23 – 70 ℃).
Figure 3.5 displays the replotted short-term IFT data in Regime I by showing ln(dΠ/dt) vs. IFT, which was then fitted using Equation 3.6. Figure 3.5A and 3.5B illustrates that the experiment data can be well fitted by the Ward-Tordai adsorption model (Equation 3.6) for all the cases of different asphaltene concentrations and various temperatures. In Figure 3.5A, the fitting lines show almost the same slope, with an effective area ΔA 3.7-4.1 nm2, which indicates that the area created at the interface during the diffusion-controlled regime is almost constant regardless of asphaltene concentration. According to previous studies [35], the average asphaltene molecular diameter is about 2 nm. The structure of asphaltene molecules is analogous to plate disk. When adsorbed at the interface between a good solvent and water, polyaromatic cores of asphaltene molecules tend to stay parallel to the interface with the aliphatic chains extended into the oil phase [36]. So it is reasonable to estimate the average interfacial area of asphaltenes molecules or stacked molecules (nanoaggregates) (to be ~3.14 nm2, which is close to effective area ΔA obtained in our analysis above. Figure 3.5B further shows that the slope of fitting line decreases with increasing the temperature under fixed asphaltene concentration of 100 mg/L. The estimated effective area ΔA decreases from 4.2 nm2 to 2.1 nm2 when the temperature is raised from 23 ℃ to 70 ℃, which suggest that the configuration of asphaltene molecules at the oil/water interface might change under high temperature. It is also noted that the DLS results (Figure 3.1) show that the average size of asphaltenes decreases with increasing the temperature, further supporting the results here (Figure 3.5B).
Regime II.Regime II is a transition regime between Regime I and Regime III, which does not show a linear correlation between IFT and (Figure 3.3). During this transition regime, the diffusion of new asphaltenes in the bulk to the interface would be affected by their interactions with the interfacial asphaltenes (adsorbed in the diffusion-controlled Regime I) which could provide steric hindrance for the interfacial diffusion of new asphaltenes, thus lowering the reduction rate of dynamic IFT (as shown in Regime II in Figure 3.3). The results here are consistent with previous studies which suggested that when the coverage of asphaltenes reaches 35 – 40 % of the oil/water interface, the adsorption rate of asphaltenes could decline [36].
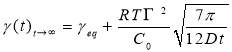
Regime III.In this regime, the dynamic IFT still decreases but very slowly with time. At the beginning of this regime, the interface has already adsorbed with a large amount of asphaltenes in Regime I and Regime II. Asphaltenes might be continuously adsorbed to the interface or sublayer of the interface due to their intermolecular attraction leading to the gradual reduction of dynamic IFT. Reconfiguration of adsorbed asphaltenes at the interface with long relaxation time might also contribute to the long-term decreasing of dynamic IFT (Figure 3.3A and 3.3B) [29, 31, 39]. As the Ward-Tordai equation is of validity to the purely diffusion-controlled process in short-term, it fails to describe the long-term adsorption of asphaltenes. To obtain the equilibrium IFT of asphaltene solutions, a previously reported model for long-term adsorption was employed here as shown in Equation 3.7, which shows that the dynamic IFT reduction at long incubation time is proportional to the reciprocal square root of time ( ) [30, 40]:
 (3.7)
(3.7)
where C0 is the asphaltene concentration (mol/m3), γeq is the interfacial tension at equilibrium state, Г is the surface excess concentration at saturation and D is the diffusion coefficient in Regime III.
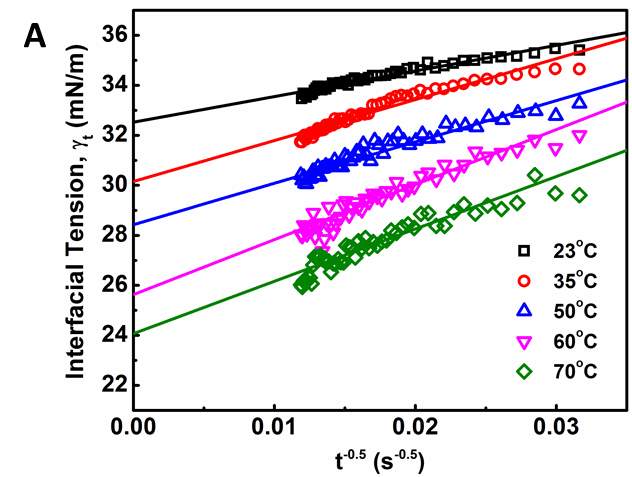
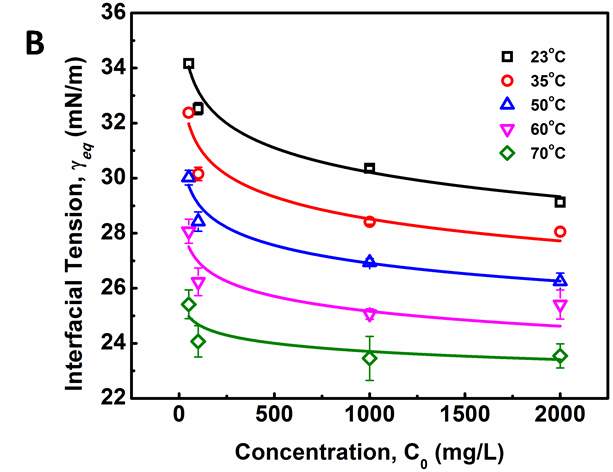
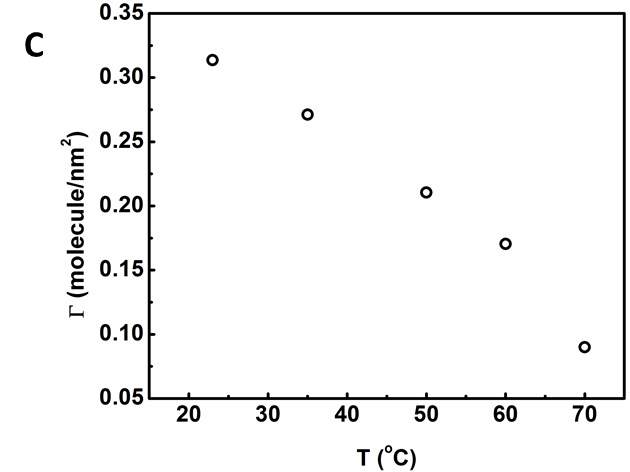
Figure 3.6 (A) Plots of γtvs t -0.5 and linear regression (solid lines) extrapolating the IFT at longer times. (B) Variation of the equilibrium IFT γeq versus asphaltene concentration as determined by extrapolation at infinite time. Solid curves are the fitting lines using Equation 3.7. (C) Maximum surface excess concentration determined from the fitted data in Figure 6B.
Figure 3.6A shows the extrapolating γ (t) vs t-1/2by linear regression to obtain γeq. Distribution of data points of dynamic IFT around solid fitting lines indicates that the long-term equation well fitted the Regime III. The obtained γeqas a function of asphaltene concentration is plotted in Figure 3.6B (the same plots as Figure 3.6A for other asphaltene concentrations are not shown here for simplicity). It could be observed that the equilibrium interfacial tension reaches a plateau at all temperatures with increasing asphaltene concentration. Threshold concentration for asphaltene solutions, which means that the saturation state and maximum adsorption of asphaltenes reached at the interface, decreases at higher temperatures.
The feasibility of Gibbs adsorption equation to describe the asphaltene adsorption to the interface has been proved by many researchers [41-43]. For an ideal system containing pure surfactant and solvent, the IFT is related to the surfactant concentration as follows
 (3.8)
(3.8)
where xi is the equilibrium mole fraction of the surfactant. The mole fraction is directly related to the concentration, hence the most commonly used expression for asphaltenes study is shown as following:
 (3.9)
(3.9)
However, in this paper, nanoaggregates formed even in 50 mg/L asphaltene in toluene solution. For different concentrations, its molar mass should vary and d ln(xi) = d ln(Ci/Mi) = d ln(Ci’). The new equation is now given by

 (3.10)
where Ci’ is the average molar concentration of asphaltenes and  is the maximum surface concentration. Mean molecular weight of 750 amu was used for the calculation. Solid lines in Figure 3.6B implied the data were fitted well by equation (3.10). Additionally, from Figure 3.6C, the maximum surface excess concentration fitted from Figure 3.6B decreased from 0.31 to 0.09 molecule/nm2 as the temperature increased from 23 to 70 ℃. The weight percentage of adsorbed asphaltenes at the interface to the total asphaltenes in the bulk can be estimated from the results. Taking an example of 2000 mg/L asphaltene solution at 23 ℃, the droplet volume and interface area were 33 mm2 and 18 μL respectively. The total amount of asphaltenes in the droplet was approximately 3.6
 10-5 g. However, the adsorbed asphaltenes at the interface were roughly 0.210-7 g. So the percentage of asphaltenes present near the interface was around 0.06 wt% for 2000 mg/L asphaltenes at 23 ℃. Similar results were proved by Chaverot et al. [44] that only a small weight percent of asphaltenes presenting in the bulk solution would be adsorbed to the oil/water interface.
3.3.3 Adsorption Process of Asphaltenes
According to the mentioned analysis of adsorption kinetics of asphaltenes to the oil/water interface, a summary of adsorption process is shown in Figure 3.7 A typical dynamic IFT curve is displayed in Figure 3.7A, which is generally divided into three stages. Regime I, schematic of which has been shown in Figure 3.7B, was a diffusion-controlled regime during which asphaltenes diffuse to the interface spontaneously. The initial IFT decay rate appears to be linear with the square root of time. Regime II shows up when surface excess concentration reached a critical value. Steric hindrance of adsorbed asphaltenes started to influence asphaltene adsorption kinetics leading to the slowdown of dynamic IFT decay rate as shown in Figure 3.7C. Figure 3.7D illustrates the mechanism of Regime III when the interface is filled with adsorbed asphaltenes. Continuous adsorption, as well as reconfiguration, of asphaltenes happens at the interface because of cross-linking of the aliphatic chains decreasing the dynamic IFT in long term.
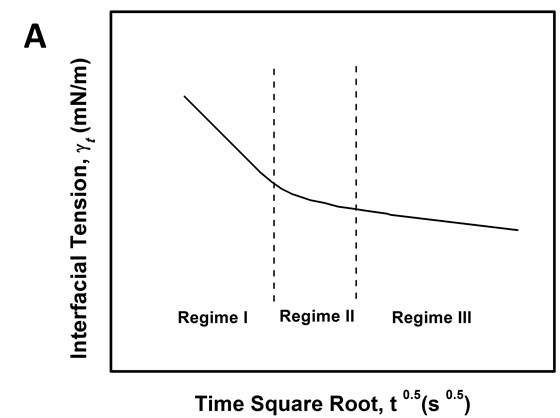
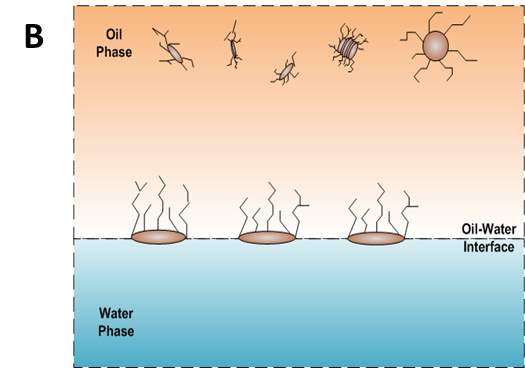
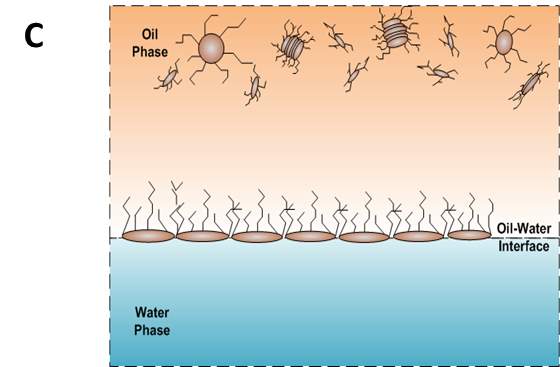
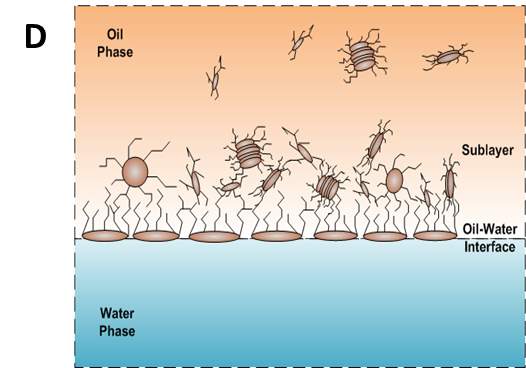
Figure 3.7(A) Typical dynamic interfacial tension response of asphaltene in toluene solution adsorbing to the oil/water interface. (B) Schematic of planar asphaltenes adsorption at the interface in Regime I. (C) Schematic of planar asphaltenes adsorption at the interface in Regime II when steric hindrance started to slow down the adsorption. (D) Schematic of asphaltene adsorption at the interface in Regime III. Interface became filled with asphaltenes. Asphaltenes may also be adsorbed at the sublayer as a result of cross-linking.
The adsorption kinetics of asphaltene at oil/water interface were investigated by the analysis of dynamic IFT using pendant drop shape method with the asphaltene concentration range of 50 – 2000 mg/L and at temperatures of 23 ℃ – 70 ℃. The dynamic IFT decreases with increasing asphaltene concentration and temperature. The adsorption kinetics can be divided into three regimes. Regime I is a short-term diffusion-controlled process. Regime II is a transition area when the steric hindrance starts to impede the adsorption. Regime III is a long-term adsorption process. The diffusion coefficient becomes higher at lower asphaltene concentration and higher temperature. The equilibrium value of IFT is calculated by the fitting information of long-term adsorption equation, which is able to be further fitted by Gibbs adsorption equation to obtain the maximum surface access concentration. According to the results, it is reasonable to conclude that maximum surface access concentration of asphaltene decreases with increasing temperature, which is coincident with the fact that oil-in-water or water-in-oil emulsion stability would decrease at higher temperatures. When the temperature is 70 ℃, the maximum surface access concentration reduces to approximately one-third of that at 23 ℃. To conclude, our results improves understanding of the mechanism behind asphaltene adsorption at the oil/water interface and throw light on adsorption kinetics under high temperature which would be more closely related to the industry.
Chapter 4 Calcium Chloride Effect on the Interfacial Properties of Asphaltenes
Emulsions are generally defined as mixtures formed by two immiscible liquids [1-3]. Emulsions have been investigated for many decades in a wide range of industries such as food [1, 4], pharmaceuticals [5] as well as oil and gas industry [2, 6-8]. In the petroleum industry, emulsions are undesirable, detrimental and yet unavoidable in the downstream with the extraction processing [6, 16]. The emulsion droplets elevate the viscosity of crude oil drastically with serious negative effects no matter in the transportation process or pumping process. Equipment failure caused by corrosion is another problem attributed to emulsion droplets as salt and brine are trapped in the aqueous phase [2, 9-10]. Undesired stable water-in-oil or oil-in-water emulsions also decrease oil recovery and affect oil water separation leading to challenging issues in the crude oil productions. To investigate the water-in-oil emulsions, tremendous effort has been dedicated to solve the problems which has been proved that several aspects should be responsible for the stability of water-in-oil or oil-in-water emulsions, for instance asphaltenes [7, 10-14], inorganic particles [2, 15], solubility of components in different solvent types [11, 13-14], carboxylic acid [2], etc. Asphaltene is one of the main reasons among all the different aspects. As a consequence, it is essential to interpret the mechanism behind the stability of water-in-oil emulsions caused by asphaltenes.
Aforementioned, surface-active asphaltenes are believed to be the main heaviest and indigenous components in crude oil functioned as stabilizers to the formation of emulsions, which are empirically defined as soluble in aromatic solvent (e.g. toluene) and insoluble in alkane solvent (e.g. pentane or heptane). The solidlike film or two-dimensional gel [17-20] at the interface, formed by asphaltenes, would impede droplet coalescence [21] as self-association or consolidation of adsorbed asphaltenes at the oil/water interface. The composition of asphaltenes is rather complex, the structure of is not yet accurately discovered and still under controversy. However, the recent study results are more prone to support the island model, which indicates that asphaltenes likely consist of polyaromatic hydrocarbon cores with aliphatic chains attached to the side [22, 23]. According to Yen-Mullins model, asphaltene molecules will self-associate and form nanoaggregates, with the aggregation number less than ten, as a result of the π-π interaction between fused aromatic rings. Clusters will be further formed by nanoaggregates because of the crosslinking of aliphatic chains [7, 22-24, 27].
It has been well-appreciated that emulsion stability is highly dependent on the properties of the interface, which attracts extensive investigations on the interfacial properties studies such as IFT and interfacial rheology of the crude oil [13, 28-35]. Considering that other components in the crude oil (e.g. resins) influence the adsorption properties of asphaltenes [25, 26], a lot of studies focused on the independent system of asphaltenes extracted from various sources to elucidate interfacial properties [17, 18, 36-61]. The studies contained the effects of aging time [37, 39, 42, 47, 50, 52], asphaltene concentration [37, 39, 42, 47, 50-54, 56, 59], categorized asphaltenes by extraction method such as C5 and C7 asphaltenes [48, 51], polarity of solvent [26, 37, 58], ratio of resin/asphaltene [25, 26, 51, 60], temperature/pressure of the oil/water system [43, 48, 56, 57] and PH value of the aqueous phase [49, 55, 61]. Because of the adsorption of asphaltene molecules to the interface, the elevated asphaltene concentration leads to the reduction of IFT and an equilibrium state of IFT will be reached. By plotting equilibrium IFT vs asphaltene concentration, critical micelle concentration (CMC) was obtained and interfacial area of asphaltene molecules was calculated at the initial stage of investigation in this field [41, 42]. It was also found that equilibrium IFT increased with the increasing pressure and volume percentage of heptane in heptol [43]. Even though a lot of studies on IFT simply focus on the equilibrium IFT, the mechanism behind the dynamic IFT still needs to be further investigated.
Those mentioned experimental conditions also affect interfacial dilatational rheology as reported by many other authors. The elastic modulus increased significantly after the interface being aged for a long time [39, 50]. With the increasing asphaltene concentration, the elastic modulus increased first and then decreased by presenting a peak at 100 mg/L to 200 mg/L [39, 49, 51]. LVDT model fitted the curves of elastic modulus versus asphaltene concentration very well when the interface was generated and stabilized in a short time (~ 5min) [37, 40, 49]. Nevertheless, the LVDT model was invalid to simulate elastic modulus if the generated asphaltene interface was aged for a longer time as the LVDT model did not count for the interaction or reconfiguration of adsorbed asphaltene molecules [39, 40]. Frequency is another key factor to the interfacial rheology studies, which has a positive impact on the increasing elastic modulus in general [47, 49-51]. With the increasing polarity of the solvent, for instance adding heptane into toluene or xylene, the elastic modulus of interfacial dilatational rheology exhibited a gradual increase tendency at a low range of asphaltene concentration [26]. However, the experiment results of solvent type effect were controversial at high asphaltene concentration due to the unavoidable asphaltene aggregation [26, 37]. In addition, both the high and low PH value of the aqueous phase enhanced the elastic modulus [49].It has been widely acknowledged that interfacial dilatational rheology provides insights on the rigid film formed at the interface. However, more investigation is still needed on the relationship between specific value of interfacial rheology and emulsion stability.
Injection of low-salinity brine has been considered as one of the primary processes beneficial to enhanced oil recovery (EOR). Consequently, the salinity effect on the oil/water system was investigated by many researchers [28-35]. M. Fortuny et al. [31] reported that the existence of sodium chloride in the aqueous phase enhanced elastic modulus and induced a more rigid interfacial film. Similar results were obtained by K. He et al. [28, 29] in the recent studies, which showed that from low-salinity to high-salinity of KCl the oil recovery was restrained. In the experiments conducted by Bai [62], with the increasing sodium chloride concentration, the IFT of both asphaltene and crude oil system were elevated. To better understand the mechanism of asphaltenes under different salinity conditions, it is essential to investigate interfacial properties of asphaltenes independently. Lashkarbolooki et al. [36, 44] found that calcium ions had a better affinity to asphaltene molecules by hackling the molecular management than magnesium ions. However, compared with wide studied crude oil/water system, the interfacial behavior of asphaltenes with the impact of calcium chloride was not yet studied.
In this chapter, the interfacial properties of extracted asphaltenes were investigated along with the emulsion stability under different calcium chloride concentrations in the aqueous phase. Pendant drop shape method was utilized during the experiments to obtain the data of IFT and interfacial dilatational rheology. The dynamic IFT and surface pressure were primarily divided into two main stages to study short-term and long-term adsorption of asphaltene adsorption kinetics. According to the results of interfacial dilatational rheology along with compressibility studies, the reconfiguration of adsorbed asphaltenes was proved to be enhanced with the existence of calcium chloride. By combining IFT and interfacial rheology, it is predictable to estimate the emulsion stability through interfacial properties. The released volume ratio of water by emulsion stability tests indicated the feasibility of the postulation based on IFT and interfacial dilatational rheology. In addition, it is the first time to scientifically study the calcium chloride effect on the independent asphaltene system in aqueous phase. The fundamental studies on dynamic IFT, adsorption kinetics, interfacial dilatational rheology as well as emulsion stability would help to elucidate some detrimental phenomena and have the implication to elevate the oil recovery in the oil and gas industry.
In this study, Milli-Q water (Millipore deionized), with a resistance of ≥ 18.2 MΩ∙cm, was used to prepare the aqueous solutions. Sodium chloride (NaCl) and calcium chloride dihydrate (CaCl2∙2H2O) purchased from Sigma-Aldrich Canada were used as received for preparing the salinity solutions. High purity toluene, n-heptane and methylene chloride were purchased from Fisher Scientific Canada and used as received. Asphaltene samples were extracted from bitumen offered by Shell.
ASTM IP 143 procedure [63] was used to extract asphaltenes from bitumen samples. The brief process was listed as follows. Bitumen was diluted by n-heptane first to the bitumen/n-heptane ratio of 1:30 (g/mL). The mixture of bitumen and n-heptane was stirred for 1 h and then cooled down to ambient temperature for another 2.5 h. The mixture was filtered afterward and a Soxhlet extractor was utilized to remove components that were soluble in n-heptane. Methylene chloride was then used to extract raw asphaltenes from the residual. After that, the asphaltenes in methylene chloride solution was concentrated and dried under pure nitrogen flow to obtain solid asphaltene samples. The asphaltene samples were stored in sealed glass vials to avoid oxidation.
Solid asphaltene samples were dissolved in toluene to the concentration of 1000 mg/L as a stock solution. The stock solution would be diluted to specific concentration just before the experiments. The concentrations of asphaltenes in toluene solutions in this paper were 10 mg/L, 50 mg/L, 100 mg/L, 500 mg/L and 1000 mg/L. The specific concentration of asphaltene solution was prepared 24 h ahead of each measurement. In order to avoid unexpected large aggregation and oxidation of asphaltenes, the asphaltene solutions would be discarded 48 h after preparation.
To investigate the effect of calcium, the aqueous saline solutions were prepared at concentrations of 0 mol/L, 0.5 mol/L and 1.5 mol/L calcium chloride in Milli-Q water with the addition of 0.5 mol/L sodium chloride as background solution to mimic brines in the industry. So the molar ratios between calcium and sodium ions in the brine throughout this study were 0:1, 1:1 and 3:1 respectively.
4.2.3 Dynamic interfacial tension tests
In this study, reversed pendant drop shape method was used for the measurement of the dynamic IFT of the asphaltene solution and brine system. The apparatus was a contact angle goniometer and tensiometer purchased from Ramé-hart Instrument Company, USA. Briefly, a light resource was utilized to illuminate the organic droplet and the aqueous phase uniformly and also connected by an optical bench to avoid accidental vibration. The asphaltene solution was loaded into a 10 mL syringe, on the top of which was connected with a U-shaped needle because of the smaller density of organic phase compared with the aqueous phase. The needle was immersed in the brine which was placed in a transparent quartz cell. A droplet would be generated at the top of the needle. The shape of the droplet was captured by a CCD camera in real-time and images were saved in a connected PC. Calibration by a standard sphere was required before conducting all the experiments.
The densities of brine and asphaltene solution in different conditions were calculated and typed into the software before each measurement. For each dynamic IFT test, the droplet was stabilized for 7200 s and the IFT was measured every two seconds automatically after the asphaltene droplet was generated.
4.2.4 Interfacial dilatational rheology tests
The same tensiometer was used to measure the interfacial dilatational rheology of the oil/water system which illustrated the total interfacial elasticity and its two main components, elastic and viscous modulus. The harmonic vibration was generated during the measurement and the amplitude was set as 0.6 µL (~3% to the initial droplet volume). Three periods were performed for each test by recording three hundred points per period. Asphaltene solution was controlled to be pumped inside or outside of the microsyringe by the combination of two automatic pumps.
Effects of frequency and aging time under different calcium chloride concentrations were investigated for this section. When studying the frequency effect, a droplet with the asphaltene concentration of 1000mg/L was generated and tested under the oscillation frequency of 0.005 Hz, 0.01 Hz, 0.02 Hz, 0.05 Hz, 0.1 Hz, 0.2 Hz respectively. All the measurements to study frequency effect were performed after 25 min aging time. Elastic and viscous modulus changing with aging time were measured at each 30 min up to 270 min. The oscillation frequency was selected as 0.1 Hz to investigate aging time effect and background solutions were still 0.5 M NaCl, 0.5 M NaCl + 0.5 M CaCl2, 0.5 M NaCl + 1.5 M CaCl2.
To study the compressibility and crumpling of the rigid asphaltene film formed at oil/water interface, compressibility experiment was conducted for 0.5 and 2 h of aging time with three aqueous solutions. An asphaltene solution with the concentration of 1000 mg/L was pumped into the needle and a droplet was formed at the top of the needle with the volume around 20 µL. After stabilized for a certain aging time, the droplet was shrunk stepwise by 1 µL each time under the control of the pump. The period of 100 s to 200 s was needed to achieve the equilibrium of IFT after each shrink, during which the dynamic IFT would be captured timely. The stepwise shrink would be stopped when obvious crumple was observed at the interface through the camera.
4.2.6 Emulsion stability studies
Water-in-oil emulsion system was obtained to mimic the situation in the real industry and to investigate how asphaltene molecules were able to stabilize the system under different calcium chloride concentrations. In addition, the emulsion stability studies were the strong support to the hypothesis of IFT, IR, and compressibility studies, which displaced light on the application of interfacial studies of calcium effect. An agitator (T18 digital ULTRA TURRAX, IKA, Germany) was utilized to blend 20 vol% of brine solution (0.5 M NaCl, 0.5 M NaCl + 0.5 M CaCl2, 0.5 M NaCl + 1.5 M CaCl2) and 80 vol% of asphaltene solution. The emulsions were produced by following a standard procedure which consists of a pre-emulsification stage and an emulsification stage. During the emulsification stage, brine water droplets were added into the organic phase stepwise. The homogenization conditions were set at 15,000 rpm and 10 min. The prepared emulsions were aged at ambient temperature for 20 h after the homogenization. Afterward, the remained emulsion, separated from the layered samples, was injected into a graduate tube. The loaded tube was then placed into a silica oil bath at 90 °C for 10 h and the released water layer was monitored every single hour to obtain the equilibrium volume of water.
Theoretical consideration of this study was divided into three sections: (1) IFT with two stages, short-term and long-term adsorption (2) interfacial dilatational elasticity consisting of elastic modulus and viscous modulus (3) compressibility studies.
With the adsorption of asphaltene molecules to the interface, IFT will decrease. In the previous studies by other researchers, dynamic IFT changing with aging time was analysed by two main stages, short-term and long-term adsorption [38, 47, 52].
4.3.1.1 Short-term adsorption
A diffusion-controlled process is generally used to describe the irreversible adsorption process of asphaltenes to the oil/water interface as a result of large molecular weight [39, 40, 64]. As reported, the desorption process could be neglected during the short-term adsorption model derived from Word-Tordai equation [65], leading to
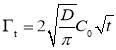 (4.1)
(4.1)
where Гt is the interfacial concentration of asphaltene molecules, D is the diffusion coefficient of asphaltene molecules moving to the interface and C0 is the asphaltenes bulk concentration. The surface excess concentration Гt can be associated with surface pressure Πt as shown in the following equation [53, 56]:
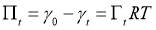 (4.2)
(4.2)
Equation (4.3) can be obtained by combing equation (4.1) and equation (4.2), known as the Gibbs-Duhem diffusion equation:
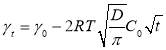 (4.3)
(4.3)
According to the equation (4.3), γt should be proportional to
tfor a purely diffusion controlled process and D could be calculated based on the slope obtained from the curves of γt vs
t.
4.3.1.2 Long-term adsorption
According to Figure 4.1, it can be observed that the dynamic IFT still decreased with time at the end of each experiment. So it was essential to obtain the equilibrium IFT by extrapolating to long times. The long-term dynamic IFT data varying with long aging time were fitted with the following approximation equation [56, 66]:
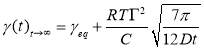 (4.4)
(4.4)
where γeq is the equilibrium IFT, R is the universal gas constant, T is the temperature, Γ is the asphaltene surface concentration, C is the asphaltene molar concentration, D is the long-term diffusion coefficient. According to the equation (4.4), the long-term dynamic IFT should be linear to the reciprocal square root of time and the equilibrium IFT would be obtained by the fitting information.
From the Gibbs adsorption isotherm, the obtained equilibrium IFT is related to the composition of the system. The following equation was used to fit the equilibrium IFT versus asphaltene concentration under different calcium concentrations:
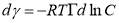 (4.5)
(4.5)
where γ is the IFT at equilibrium, C is the bulk concentration of asphaltenes, and Г is the equilibrium interfacial excess concentration of asphaltenes at oil/water interface.
4.3.2 Viscoelastic studies
Interfacial elasticity, ε, can be obtained by harmonic oscillations, which is defined as follows:

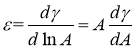 (4.6)
(4.6)
where γ is the IFT in real time and A is the interfacial area of the droplet. The interfacial elasticity consists of a real and an imaginary component as shown below:
 (4.7)
(4.7)
where
ε’is the elastic modulus and
ε”is the viscous modulus. The elastic and viscous modulus can be further defined by the phase shift (
∅) between the area and IFT oscillations.
 ,
,  (4.8)
(4.8)
The elastic modulus is often assumed as approximately the same as interfacial elasticity, the so-called instantaneous elasticity, at high frequencies or viscosities. A controlled decrease on the interfacial area was conducted during the compression experiments. The compressibility is described as the equation (4.9) [9, 37]:
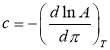 (4.9)
(4.9)
where c means the compressibility of the interfacial film, A stands for the film ratio (the ending interfacial area to the initial interfacial area), π represents the surface pressure of the interface. The reciprocal of compressibility (1/c) is generally used to describe the rigidness of the glassy film formed by asphaltene molecules, in other words, a higher value of 1/c indicates a more rigid film.
4.4 Results and Discussion
4.4.1 Dynamic IFT and Surface Pressure
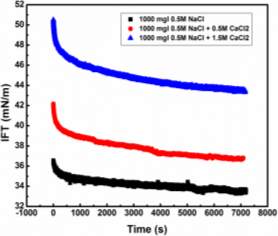
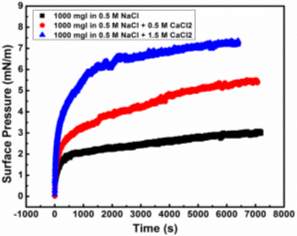
Figure 4.1(A) Dynamic IFT of asphaltenes solutions vs agimg time at different calcium concentrations (0.5M NaCl, 0.5M NaCl + 0.5M CaCl2, 0.5M NaCl + 1.5 CaCl2) tested at ambient temperature. (B) Surface pressure of asphaltene solutions vs time at different calcium concentrations (0.5M NaCl, 0.5M NaCl + 0.5M CaCl2, 0.5M NaCl + 1.5M CaCl2) tested at ambient temperature.
Figure 4.1 is the measured dynamic IFT and surface pressure versus aging time at different brine solutions. Blue, red and black lines are IFTs obtained from the aqueous phases of 0.5M NaCl + 1.5M CaCl2, 0.5M NaCl + 0.5M CaCl2 and 0.5M NaCl respectively. Figure 4.1 A shows dynamic IFTs of the system of 1000 mg/L asphaltene in toluene solution and brine solutions. For simplicity, only 1000 m/L asphaltene in toluene solution is shown here as a representative. According to Figure 4.1, it can be observed that dynamic IFT drops drastically in the first several hundred seconds and then the decay rate decreases with increasing aging time. At the end of the experiment, the dynamic IFT curve seems to reach a plateau. The addition of calcium ions in the aqueous has a significant effect on the dynamic IFT and equilibrium IFT which will increase the IFTs significantly at the room temperature. In addition, the total decrease amount of IFT from the beginning to the ending of aging time is much more noticeable at higher calcium chloride concentration. Specifically, IFT reduces by 3.01 mN/m from 36.55mN/m to 33.54 mN/m without calcium chloride, while this number rises to 7.1 mN/m from 50.5 mN/m to 43.4 mN/m with 1.5 M calcium chloride. To better understand adsorption mechanism of asphaltenes, the data of dynamic IFTs versus time was replotted as surface pressure vs time which is shown in Figure 4.1 B. Surface pressure was calculated by the difference value between initial IFT (γ0) and dynamic IFT (γt) as shown in equation 4.2. Figure 4.1 B shows that the surface pressure increases significantly during the first several hundred seconds and then reaches a plateau in the end. With the increasing concentration of calcium ions, the surface pressure increases, which indicates that more asphaltene molecules are adsorbed to the oil/water interface per area as induced by calcium chloride. To analyse the calcium ions effect on the adsorption kinetics of asphaltene molecules, the dynamic IFT was further divided into short-term and long-term adsorption stages.
4.4.1.1 Short-term adsorption
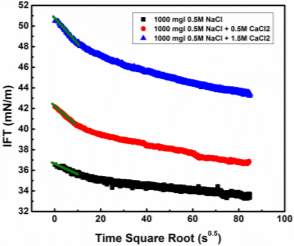
Figure 4.2 Dynamic IFT vs time square root at different calcium concentrations (0.5M NaCl, 0.5M NaCl + 0.5M CaCl2, 0.5M NaCl + 1.5M CaCl2) tested at ambient temperature. Green solid lines are the fitting lines for short-term adsorption.
Figure 4.2 shows the dynamic IFT versus time square root for short-term adsorption stage with different calcium ions concentrations at the room temperature. Green solid lines indicate that the data were fitted quite well by equation 4.3 for the first a hundred seconds. During this short-term adsorption stage, the process is purely diffusion controlled which means asphaltene molecules diffuse spontaneously to the ‘empty’ oil/water interface. However, this diffusion controlled regime will not last for a long time. Once the surface coverage of adsorbed asphaltene molecules surpasses a specific critical value, the steric hindrance starts to play a crucial role in impeding the adsorption. According to the short-term fitting information, how the slope and diffusion coefficient change with asphaltene concentration and calcium chloride concentration are illuminated.
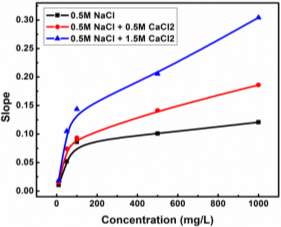
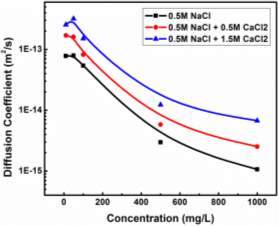
Figure 4.3 (A) Slope vs asphaltene concentrations at different calcium concentrations (0.5M NaCl, 0.5M NaCl + 0.5M CaCl2, 0.5M NaCl + 1.5M CaCl2) tested at ambient temperature. (B) Diffusion coefficient vs asphaltene concentrations at different calcium concentrations (0.5M NaCl, 0.5M NaCl + 0.5M CaCl2, 0.5M NaCl + 1.5M CaCl2) tested at ambient temperature.
Figure 4.3 A and Figure 4.3 B are the obtained fitting information which indicate slope and diffusion coefficient changing with asphaltene concentration at different calcium chloride concentration. According to Figure 4.3 A, it can be observed that the slope of dynamic IFT versus time square root becomes higher when more calcium chloride was added in the aqueous phase, with the meaning that the IFT decreases faster with calcium chloride in the system. In general, the slope increases with increasing asphaltene concentration. Specifically, the slope increases drastically when the asphaltene concentration ranges from 10 mg/L to 100 mg/L, after which the slope rises continuously but slowly when the asphaltene concentration beyond 100 mg/L. Diffusion coefficient can be derivate from slope and displayed in Figure 4.3 B. With the increasing asphaltene concentration, diffusion coefficient decreases remarkably, whereas it increases with the addition of calcium chloride, which means that asphaltene molecules diffuse slower to the oil/water interface at higher asphaltene concentration, however, faster with the calcium chloride in the aqueous phase. At higher asphaltene concentration, the average hydrodynamic radius of asphaltene molecules becomes larger according to the previous study which is possibly responsible for the decreased diffusion coefficient as similar results reported by other researchers. With the existence of calcium chloride, the higher calcium chloride concentration in the brine solution near the oil/water interface induces the adsorption of asphaltene molecules as similar functions like cation or anion ions.
4.4.1.2 Long-term adsorption
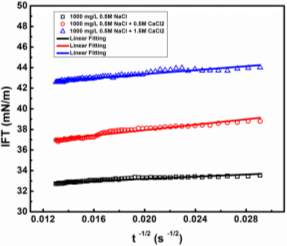
Figure 4.4 Long-term dynamic IFT vs reciprocal time square root at different calcium concentrations (0.5M NaCl, 0.5M NaCl + 0.5M CaCl2, 0.5M NaCl + 1.5M CaCl2) tested at ambient temperature. Solid lines are linear regression extrapolating the IFT at longer times according to the long-term adsorption equation.
It can be observed from Figure 4.2 that it is extremely hard for dynamic IFT to reach a plateau after replotted by time square root. For the long-term adsorption stage of asphaltene molecules, the decay rate of dynamic IFT versus time square root is relatively low but still exists until the end of experiments. In this regime, it is hypothesised that the interface is filled with asphaltene molecules and the continuous decrease of dynamic IFT may be caused by both the reconfiguration of adsorbed asphaltene molecules and the asphaltene molecules migrating from the bulk solution to the sublayer. To calculate the maximum concentration of asphaltenes at the oil/water interface, it is essential to obtain accurate equilibrium IFT of the system. Figure 4.4 exhibits the relationship between dynamic IFT and reciprocal time square root at different calcium chloride concentrations and the solid lines are the fitting lines by equation 4.4, which indicates that the long-term dynamic IFT data is fitted well by the equation. The equilibrium IFT of oil/water interface is then obtained by extrapolating the data to infinity. The calculated equilibrium IFT changing with logarithm asphaltene concentration under three different calcium chloride concentrations has been shown in Figure 4.5 A. From Figure 4.5 A, several observed phenomena have been listed as follows. First, equilibrium IFT increases obviously with the increasing calcium chloride concentration which means the interface potential energy is enhanced by the salinity. The calcium chloride concentration has a relatively dominant effect on the equilibrium IFT at lower asphaltene concentration. For instance, at 10 mg/L asphaltene solution, equilibrium IFT rises from 37.4 mN/m to 53.3 mN/m by 15.9 mN/m when the calcium chloride concentration increases from 0 M to 1.5 M. However, at the asphaltene concentration of 1000 mg/L, the increment value becomes 9.6 mN/m (from 32.6 mN/m to 41.9 mN/m). Second, with higher calcium chloride concentration, the equilibrium IFT decreases much faster than that under lower calcium chloride concentration. At 0 M and 1.5 M calcium chloride, the difference value of equilibrium IFT is 4.8 mN/m and 11.4 mN/m respectively. Third, the equilibrium IFT data points distribute closely around the solid lines which means Gibbs adsorption equation fits the data quite well. The values of R square are 0.98, 0.92 and 0.99 respectively for 0.5M NaCl, 0.5M NaCl + 0.5M CaCl2 and 0.5M NaCl + 1.5M CaCl2 by the fitting of Gibbs adsorption equation. The maximum surface excess concentration of asphaltenes can be obtained from the fitting of Gibbs adsorption equation and is shown in Figure 4.5 B. It is observed that maximum surface excess concentration increased from 4.28
× 10-7mol/m2 to 1.03
× 10-6mol/m2 with the increasing calcium chloride concentration from 0 M to 1.5 M. So, when there is no calcium chloride existing in the aqueous phase, the average area occupied by per asphaltene molecule at final equilibrium state is 3.88 nm2, however, this value decreases to 1.6 nm2 at the calcium chloride concentration of 1.5 M, based on which it is reasonable to hypothesis that at higher concentration of calcium chloride more asphaltene molecules were adsorbed to the oil/water interface and stabilized the water-in-oil emulsion.
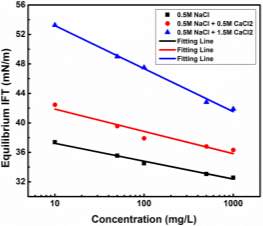
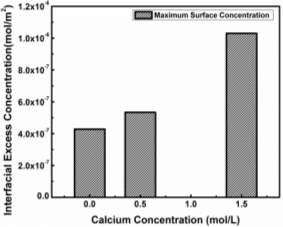
Figure 4.5(A) Variation of the equilibrium IFT vs logarithm asphaltene concentrations as determined by extrapolating at longer time at different calcium concentrations (0.5M NaCl, 0.5M NaCl + 0.5M CaCl2, 0.5M NaCl + 1.5M CaCl2). Solid lines are the fitting lines according to Gibbs adsorption equation. (B) Interfacial excess concentration vs calcium concentration determined from the fitted information by Gibbs adsorption equation.
4.4.2 Interfacial Dilatational Rheology
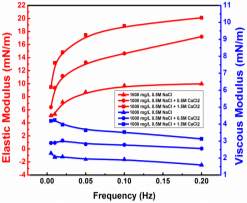
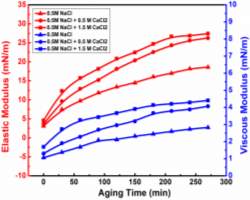
Figure 4.6(A) Effect of oscillation frequency on elastic and viscous modulus in the system of asphaltene in toluene solution and brine solution. (B) Effect of aging time on elastic and viscous modulus in the system of asphaltene in toluene solution and brine solution.
Frequency is one of the most important indicators investigated by many researchers in the dilatational rheology area. Figure 4.6 A presents the frequency effect on elastic and viscous modulus at different salt concentrations. It can be verified that elastic modulus is much higher than viscous modulus which indicates that the interfacial film formed at the oil/water interface is more solid-like and elastic. An enhancement of elastic modulus is observed along the increasing frequency, whereas viscous modulus shows a slight decay. It can be also noted that a significant increase is obtained by the elevated salinity of aqueous phase. Figure 4.6 B shows the evolution of the elastic and viscous modulus along with the aging time at different salt concentrations. Similar to frequency effect, elastic modulus takes a dominant role in the interfacial elasticity and both elastic and viscous modulus increase with the addition of calcium chloride. Elastic and viscous modulus have the similar trend with the increasing aging time, specifically rising significantly in the first 60 minutes, increase rate slowing down afterwards and reaching a plateau at the end of experiments. In Figure 4.1 A and Figure 4.1 B, the continuous reduction of dynamic IFT and enhancement of surface pressure are negligible compared with the variation of elastic and viscous modulus at longer aging time, suggesting that reconfiguration of adsorbed asphaltene molecules at the interface instead of continuous adsorption should be mainly responsible for the enhanced modulus. The increase of both elastic and viscous modulus is more evident with the presence of calcium chloride in the aqueous phase compared with no calcium chloride in the system, indicating that the rearrangement of adsorbed asphaltene molecules becomes intense as induced by the calcium chloride. To conclude, a more rigid and elastic film leading to a more stable water-in-oil emulsion is formed with the presence of the calcium chloride from Figure 4.6 A and Figure 4.6 B.
4.4.3 Compressibility Results
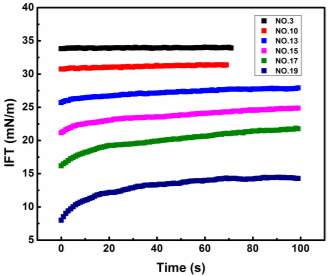
Figure 4.7 Dynamic IFT of compressibility test of 1000 mg/L asphaltene solution in 0.5 M NaCl at 0.5 h of aging time with the stepwise measurement number of 3, 10, 13, 15, 17 and 19.
To build the relationship between interfacial properties (e.g. IFT and interfacial rheology) and emulsion stability, compressibility experiments are conducted to illuminate the mechanism and properties of oil/water interface deformation which could be utilized to explain emulsion stabilised by asphaltenes. Reversible or irreversible adsorption of asphaltenes to the oil/water interface is still under controversy by many researchers. If the adsorption of asphaltenes is purely reversible process, by the method of compressibility measurement in this study, no detectable change would appear in compressibility when the film is compressed, which is contradictive to the results of the experiments. However, if the adsorption of asphaltene molecules is hypothesised as a purely irreversible process, the dynamic IFT captured in real time should be independent of aging time after each shrink of the oil droplet. Figure 4.7 illustrates the dynamic IFT versus aging time during the compressibility test of 1000 mg/L asphaltene solution in 0.5 M NaCl at 0.5 h with the stepwise measurement number of 3, 10, 13, 15, 17 and 19. It can be observed that for the first few tests (less than ten) of compressibility study IFT is independent of aging time and IFT decreases with the continuous shrink of droplet volume (decreasing film ratio) which means that adsorbed asphaltene molecules still stay at the oil/water interface and the adsorption process is irreversible. But the IFT tendency differentiates with at lower film ration. To be specific, dynamic IFT starts to increase with the increasing aging time initially and reaches a plateau in the end which indicates that desorption of adsorbed asphaltene molecules occurs and the adsorption process can be partially reversible as induced by the low film ratio. In brief, a certain threshold of film ratio exists and has a significant effect on the reversible/irreversible adsorption of asphaltene molecule. When film ratio is higher than the threshold, the adsorbed asphaltene molecules are preferred to be irreversible and dependant of the film ratio, however, the adsorbed asphaltene molecules can be preferred to be partially reversible desorbed into the bulk solution if the film ratio is lower than threshold. All the information of measured average surface pressure at various film ratios has been collected and listed in Figure 4.8.
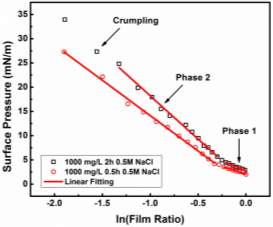
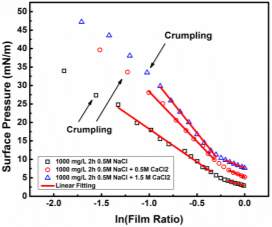
Figure 4.8(A) Compressibility results of surface pressure isotherm for 1000 mg/L asphaltene solution in 0.5 M NaCl after 0.5 h and 2 h of aging at room temperature. (B) Compressibility results of surface pressure isotherm for 1000 mg/L asphaltene solution after 2 h of aging with the aqueous phase of 0.5M NaCl, 0.5M NaCl + 0.5M CaCl2, 0.5M NaCl + 1.5M CaCl2.
Figure 4.8 A shows two surface pressure isotherms of 1000 mg/L asphaltene solution in 0.5 M NaCl solution with two aging times, 0.5 h and 2 h respectively. An apparent breakpoint can be observed for both 0.5 h and 2 h around the value of -0.25 for ln(Film Ratio) which is equivalent to 0.8 of the film ratio. In result, the surface pressure isotherm is divided into two phases (phase 1 and phase 2) and each phase can be linearly fitted by equation 4.9. For both the lines measured at 0.5 h and 2 h, the slopes of phase 2 are much higher than those of phase 1. In addition, with the increasing aging time, reciprocal of compressibility also increases with the implication that a more rigid and elastic film formed at the interface as the reconfiguration and/or crosslinking of adsorbed asphaltene molecules are strengthened. Figure 4.8 B presents the results of surface pressure vs ln(Film Ratio) with different concentrations of calcium ions at the aging time of 2 h for 1000 mg/L asphaltene droplet in the aqueous solution. The fitting information about reciprocal of compressibility of phase 1 and phase 2 at different conditions of brine solutions has been listed in Table 4.1 and Table 4.2. With the addition of calcium chloride, reciprocal of compressibility of phase 1 at the aging of 0.5 h and 2 h is enhanced slightly in general. However, the enhancement of reciprocal of compressibility is much more significant for phase 2 when calcium chloride is added to the aqueous phase. If the adsorption of molecules is an ideal reversible process, the line of surface pressure isotherm should be flat which means surface pressure is independent of film ratio. While if the adsorption of asphaltene molecules is purely irreversible, the surface pressure isotherm should be constantly linear with film ratio. Thus, the slope of surface pressure isotherm illustrates the ratio of irreversibly adsorbed asphaltene molecules, which indicates that at higher concentration of calcium chloride higher percentage of adsorbed asphaltene molecules is irreversible and would stay at the oil/water interface with the shrink of interfacial area. In conclusion, three main phenomena are observed during the compressibility measurement. First, a threshold occurs and the surface pressure isotherm can be divided into two main phases. Second, the increasing aging time will help to form a more rigid film at the oil/water interface with higher elasticity and lower compressibility. Third, with the presence of calcium ions in the aqueous phase, the asphaltene film would be induced with higher reciprocal compressibility and becomes more rigid.
Table 4.1 Reciprocal compressibility values of phase 1 for the interfacial film in the system of asphaltene and brine solutions at room temperature with the aging time of 0.5 h and 2 h.
| Aqueous Phase Solutions | Phase 1 – C-1 (mN/m) | |
| 0.5h | 2h | |
| 0.5M NaCl | 6.07 | 7.89 |
| 0.5M NaCl + 0.5M CaCl2 | 5.77 | 11.16 |
| 0.5M NaCl + 1.5M CaCl2 | 7.79 | 10.55 |
Table 4.2 Reciprocal compressibility values of phase 2 for the interfacial film in the system of asphaltene and brine solutions at room temperature with the aging time of 0.5 h and 2 h.
| Aqueous Phase Solutions | Phase 2 – C-1 (mN/m) | |
| 0.5h | 2h | |
| 0.5M NaCl | 14.53 | 17.83 |
| 0.5M NaCl + 0.5M CaCl2 | 21.83 | 26.93 |
| 0.5M NaCl + 1.5M CaCl2 | 29.02 | 32.33 |
4.4.4 Emulsion Stability
Table 4.3 Volume percentage of released water of emulsion stability test at different concentrations of calcium chloride in the aqueous phase.
| Aqueous Solutions | Released Water (%) |
| 0.5M NaCl | 50.2 |
| 0.5M NaCl + 0.5M CaCl2 | 41.1 |
| 0.5M NaCl + 1.5M CaCl2 | 36.7 |
To prove the connection between interfacial properties (IFT and interfacial rheology) and emulsion stability, the stability measurement was conducted at the end of the series of experiments. Table 4.3 shows volume percentage of released water of emulsion stability test at different concentrations of calcium chloride in the aqueous phase. It can be noted that with high concentration of calcium chloride the water-in-oil emulsion shows higher stability, with released water of 50.2 vol% at 0.5 M NaCl + 0 M CaCl2 and 36.7 vol% at 0.5M NaCl + 1.5 M CaCl2. The behavior of released water is consistent with the dynamic IFT and interfacial rheology studies indicating more adsorbed asphaltene molecules at the oil/water interface and higher elasticity values of interfacial film with the existence of calcium chloride in the brine system.
4.5 Conclusion
Our study investigated the interfacial properties of oil/water system formed by asphaltene in toluene solution and brine water to display light on the effect of calcium chloride concentration. With the addition of calcium chloride in the aqueous solution, the values of IFT and surface pressure were both elevated significantly. Slopes and diffusion coefficient fitted by short-term adsorption equation also increased with the increasing concentration of calcium chloride, which indicated that the calcium chloride in the aqueous solutions would induce the adsorption of asphaltene molecules to the oil/water interface. The equilibrium IFT can be obtained by fitting information of long-term adsorption equation and then further analyzed by Gibbs adsorption equation. The enhanced interfacial excess concentration at higher concentration of calcium chloride provides potential explanation to the mechanism behind stabilized water-in-oil emulsion triggered by calcium chloride. As for the interfacial dilatational rheology, the effect of frequency, aging time and calcium chloride concentration on elastic and viscous modulus were investigated. First, with the increasing frequency, elastic modulus was observed to increase whereas viscous modulus was not affected significantly and decreased slightly. Second, both elastic and viscous modulus became higher with the growing aging time. Third, the addition of calcium chloride in the brine solutions led to higher values of elastic and viscous modulus. During the compressibility measurements, desorption of asphaltene molecules started to play a significant role on the increasing dynamic IFT when the interfacial area of oil/water system was compressed at higher film ratio, which is evidence that at lower film ratio the adsorption of asphaltene molecules is irreversible. The alteration of reciprocal compressibility values indicates that a more rigid film was formed at higher calcium chloride concentration and longer aging time. The decreasing volume percentage of released water with increasing concentration of calcium chloride proved that brine water in asphaltene solution emulsion was stabilized by calcium chloride, which was consistent with experiment results and hypothesis of IFT and interfacial rheology.
Chapter 5 Conclusions and Future Works
In this thesis, dynamic IFT, interfacial dilatational rheology, compressibility and emulsion stability tests have been conducted to better understand the interfacial properties of asphaltenes at oil/water. The effects of temperature (23 – 70 ℃), asphaltene concentration (50 – 2000 mg/L) and presence of calcium chloride (0 – 1.5 M) on the interfacial properties of asphaltenes were systematically investigated. The following major conclusions have been obtained.
- A typical dynamic IFT curve (IFT vs. time) for asphaltenes at oil (toluene)/saline water interface could be generally divided into three stages/regimes.
- It was found that during the initial stage (Regime I) the reduction of IFT appeared to follow a linear relation with the square root of time, agreeing with the Ward-Tordai model, indicating that Regime I was diffusion-controlled. In Regime I, the fitted diffusion coefficient decreased with increasing asphaltene concentration, while increased with increasing temperature. While asphaltene concentration showed a more significant influence on the diffusion coefficient as compared with temperature.
- In the transition stage (Regime II), the steric hindrance of adsorbed asphaltenes started to influence the further adsorption/diffusion of asphaltenes to the oil/water interface, leading to weakened decay rate of the dynamic IFT.
- In Regime III, the continuous adsorption of asphaltenes to the sublayer of the interface and reconfiguration of adsorbed asphaltenes would contribute to the continuous (very slow) reduction of dynamic interfacial tension. The experimental data could be fitted with Gibbs adsorption model, and the equilibrium values of IFT under varying asphaltene concentration and temperature conditions could be obtained. It was found that elevated temperature had a negative impact on the maximum surface excess concentration of asphaltenes, which was coincident with the fact that oil-in-water or water-in-oil emulsion stability would decrease with increasing the temperature.
- It was observed that the dynamic IFT and surface pressure of the oil/water interface both increased with increasing the concentration of calcium chloride in the aqueous phase. In the short-term stage, the linear relation of dynamic IFT with time square root showed the validity of Ward-Tordai Model. The fitted diffusion coefficient of asphaltenes to the oil/water interface was enhanced by the presence of calcium chloride. In the long-term stage, the obtained equilibrium IFT under varying asphaltene and calcium chloride concentrations was fitted by Gibbs adsorption model. It was observed that calcium chloride in the aqueous phase had a positive impact on the maximum surface excess concentration, indicating that more asphaltenes could be adsorbed to the oil/water interface by the induction of calcium chloride.
- The effects of oscillation frequency and aging time on the interfacial dilatational rheology have been investigated under different calcium chloride concentration. The increasing oscillation frequency had a more significant impact on the elastic modulus rather than viscous modulus, by which the elastic modulus increased first and finally reached a plateau. Both of the elastic and viscous modulus increased if the asphaltene droplet was aged, which indicated that reconfiguration/reorganization of asphaltenes happened with the increasing aging time.
- The existence of calcium chloride in the aqueous phase led to higher values of elastic and viscous modulus. It could be due to that the presence of calcium chloride induced the aggregation or reconfiguration of asphaltenes at the oil/water interface.
- The change of reciprocal compressibility values suggested that a more rigid film was formed at higher calcium chloride concentration and longer aging time, which agreed with the results of interfacial dilatational rheology.
- Aforementioned, the presence of calcium chloride enhanced the adsorption process, aggregation or reconfiguration behavior of asphaltenes, and also a more rigid film at the oil/water interface. As a consequence of the interfacial property studies, it was reasonable to make the assumption that calcium chloride could stabilize the asphaltene emulsions. The decreasing volume percentage of released water validated that calcium chloride did stabilize the water-in-oil emulsion.
The previous studies on interfacial properties of asphaltenes have covered many aspects that is commonly encountered in the oil and gas industry including aging time, concentration, solvent polarity, PH value, salinity, temperature, and pressure, etc. Most of these studies focused on the relationship of equilibrium IFT or instantaneous modulus as a function of one specific condition. However, the specific value of equilibrium IFT and instantaneous modulus generally would not be able to provide a complete picture for the whole practical process. This work has systematically and quantitatively analyzed the adsorption kinetics of asphaltenes to oil/water interface at both short-term and long-term time regimes under elevated temperatures and different asphaltene concentrations for the first time. In addition, this work has also successfully correlated the IFT data and interfacial dilatational rheology results to the emulsion stability, particularly the effect of calcium ions for the first time. This thesis contributes to supply the knowledge in this field and provide implication to the oil industry.
5.3 Future Work
In this thesis, the effects of concentration, temperature and calcium chloride on the interfacial properties of asphaltenes have been investigated. Many directions related to this research area could be further extended as shown in this section.
- Solvent polarity is a commonly encountered aspect in the oil industry. Previous studies have reported the correlation of low volume ratio of heptane in heptol (0/100 to 50/50) with emulsion stability. However, solvent polarity investigation could be expanded by using high volume ratio of heptane (50/50 to 100/0) to study the diffusion coefficient, interfacial dilatational rheology and the correlation with emulsion stability by the method in this thesis.
- The environment of high pressure is unavoidable in the upstream of the oil industry. The relation of IFT with high pressure has been reported by some researchers. However, the mechanism investigation of adsorption kinetics and interfacial dilatational rheology under varying pressure could be implemented for asphaltenes system.
- Previous studies have contained the PH effect on the IFT and interfacial dilatational rheology. While by the method of this work, adsorption kinetics of asphaltenes to the oil/water interface could be further analyzed to provide insights on the diffusion process and equilibrium state under different PH values of the aqueous phase.
- In our study, the calcium chloride effect was studied by correlating dynamic IFT, interfacial dilatational rheology, compressibility with emulsion stability. However, further experiments, such as anion effect on the interfacial properties and emulsion stability, could be conducted based on this work.
Supporting Information
Table S1. The size of asphaltenes at different concentrations at 23oC
| Concentration (mg/L) | 50 | 100 | 500 | 1000 | 2000 |
| Size (nm) | 5.6 | 6.4 | 8.4 | 10.4 | 15.4 |
Table S2. The size of asphaltenes in 2000 mg/L asphaltenes solution at different temperatures
| Temperature (oC) | 23 | 50 | 70 |
| Size (nm) | 15.4 | 14.1 | 11.21 |
Table S3. Absolute values of slopes obtained from linear fitting for asphaltenes dynamic interfacial tension curves under different temperatures
Table S4. Diffusion coefficient of asphaltene solutions at different temperatures
| Temperature
(oC) |
Diffusion Coefficient (m2/s)
50 mg/L |
Diffusion Coefficient (m2/s)
100 mg/L |
Diffusion Coefficient (m2/s)
500 mg/L |
Diffusion Coefficient (m2/s)
1000 mg/L |
Diffusion Coefficient (m2/s)
2000 mg/L |
||||
| 23 | 2.710×10⁻¹³ | 5.897×10⁻¹⁴ | 3.080×10⁻¹⁵ | 1.228×10⁻¹⁵ | 2.985×10⁻¹⁶ | ||||
| 35 | 2.786×10⁻¹³ | 7.194×10⁻¹⁴ | 4.477×10⁻¹⁵ | 1.663×10⁻¹⁵ | 4.173×10⁻¹⁶ | ||||
| 50 | 3.402×10⁻¹³ | 1.002×10⁻¹³ | 4.081×10⁻¹⁵ | 1.589×10⁻¹⁵ | 4.431×10⁻¹⁶ | ||||
| 60 | 4.321×10⁻¹³ | 1.211×10⁻¹³ | 4.597×10⁻¹⁵ | 1.633×10⁻¹⁵ | 4.165×10⁻¹⁶ | ||||
| 70 | 4.630×10⁻¹³ | 1.516×10⁻¹³ | 6.161×10⁻¹⁵ | 1.708×10⁻¹⁵ | 4.341×10⁻¹⁶ | ||||
Cite This Work
To export a reference to this article please select a referencing stye below:
Related Services
View all


Related Content
All TagsContent relating to: "Organic Chemistry"
Organic chemistry is a branch of chemistry that studies the chemical composition, properties, and reactions of organic compounds that contain carbon.
Related Articles

DMCA / Removal Request
If you are the original writer of this dissertation and no longer wish to have your work published on the UKDiss.com website then please: