Sleep Stages Classification from EEG Signal based on Stockwell Transform
Info: 8488 words (34 pages) Dissertation
Published: 28th Feb 2022
Tagged: PsychologyNeurology
Abstract
Sleep has essential role in physical health and good quality of life. Electroencephalogram (EEG) signal is used in studying sleep process and time-frequency transforms are increasingly utilized in EEG signal analysis. In this study we propose a method for classification of sleep stages from EEG signal based on an efficient time-frequency transform, namely Stockwell transform. In the proposed method, at first, Stockwell transform is used to map each 30 second epoch of EEG signal into time-frequency domains, which results in a complex-valued matrix. Then, the frequency range is divided into 11 non-overlapping segments, leading to 11 new matrices. After that, entropy features are extracted from the obtained matrices. Finally, the extracted features are applied to support vector machine (SVM) classifier to classify each epoch into one of the 2-6 sleep stages based on the number of considered stages. We consider different entropies and evaluate their performance. Two channels of EEG signal from Sleep-EDF database, namely Pz-Oz and Fpz-Cz are used in this research. The results indicate the efficiency of the proposed method in comparison with the recently introduced methods.
Index Terms: EEG signal, entropy features, sleep stages, Stockwell transform, SVM classifier, time-frequency transform.
I. INTRODUCTION
SLEEP has great influence on physical health and good quality of life. The classification of sleep stages is an important topic in sleep research. Electroencephalogram (EEG) signal which measures electrical activities produced by the brain [1], is used in studying sleep process.
According to Rechtschaffen and Kales (R&K) standard [2], sleep-state consists of two general stages: rapid eye movement (REM) and non-rapid eye movement (NREM). NREM is divided into four stages: stage 1 (S1), stage 2 (S2), stage 3 (S3), and stage 4 (S4). Therefore, the stages of six-state sleep are awake (Awa), S1, S2, S3, S4, and REM. In the five stage case, S3 and S4 in six-state are combined, and in the four stages, S1 and S2 in five-state are joined. The three stages include Awa, NREM, and REM , and two-state combines the stages REM and NREM in the three-state [2, 3].
Time domain or frequency domain transforms are usually used in EEG signal analysis. The problem with time domain analysis is the difficulty in providing any information about the feature distribution over different frequencies and the frequency variations over time. On the other hand, analysis of a signal in frequency domain makes it difficult to recognize when the frequency components occurred in time. Therefore, it is necessary to describe how the spectral contents of a signal changes with time. Time-frequency transforms which analyze the signal in both time and frequency domains [4, 5] are increasingly used in EEG analysis [6, 7].
B. Related works
Here, we review the studies in the field of sleep stages classification. In [3], sleep stages were identified using difference visibility graph (DVG). EEG signal (Pz-Oz channel) was mapped into visibility graph (VG) and horizontal VG (HVG). Then, the mean degrees of VGs and HVGs were evaluated and degree distributions of DVGs were extracted. In the classification step, support vector machine (SVM) was used to perform 2-6 sleep stages classification. The data used in the research were taken from the Sleep-EDF (Europe data format) database and an average classification accuracy of 87.5% was achieved. In [8], multi-scale entropy and autoregressive (AR) model were used to model a single-channel EEG. Then, linear discriminant analysis classifier was utilized to classify the extracted entropy values and AR coefficients into one of the five sleep stages and 83.6% classification accuracy was obtained on Sleep-EDF database.
Hassan et al. [9] used a single-channel EEG from the Sleep-EDF database. In their method, at first, EEG signal segments were decomposed into intrinsic mode functions and then statistical moments were extracted from them. Finally, bagged decision trees were employed for 2-6 sleep stages classification and 86.8% classification accuracy was reported for six sleep stages. Various statistical moments from EEG signal were extracted based on the empirical mode decomposition in [10]. Adaptive boosting and decision trees were used to perform 2-6 sleep stages classification. The success rate of six sleep stages on sleep-EDF database was 88.6%. Welch spectral transform was utilized in [11] to extract the statistical features from EEG signal. Then, K-means clustering, decision tree, and k-nearest neighbor (KNN) classifier were used to classify the sleep-state into one of the five stages. All night polysomnographic records were made by using VIASY trademark PSG device on the sleep laboratory of Meram Medical Faculty of Selcuk University. 82% accuracy rate was achieved in the research. In [12] Butterworth band-pass filters were used to decompose EEG signals of Sleep-EDF database into five sub-bands namely delta, theta, alpha, beta, and gamma. Then, various discriminating features including energy, standard deviation, and entropy were extracted from the five sub-bands. SVM classifier was used to perform two stage (S1 and AWA) sleep classification and 92% classification accuracy was reported.
Wu et al. [13] employed empirical intrinsic geometry and synchrosqueezing transform to quantify features. SVM was used to perform five sleep stages classification. They used the data of sleep center at Chang Gung Memorial Hospital, Linkou Taoyuan, Taiwan. For respiratory and EEG signals, 89.3% and 81.7% success rates were obtained, respectively. Peker et al. [14] extracted features from EEG data with the help of a dual tree complex wavelet transform. Five obtained statistical features were given to the complex-valued neural network for classification. The dataset was obtained from St. Vincent’s University Hospital and University College Dublin. The accuracy rate of 93.8% for six sleep stages was achieved according to the R&K standard. In [15], spectral features were extracted from tunable Q-factor wavelet domain. Two channels of EEG signal were used to perform classification into one of the 2-6 sleep stages from the sleep-EDF database. The classification accuracies using random forest were obtained as 90.3% and 87.1% for Pz-Oz and Fpz-Cz channels, respectively, in the six sleep stages.
C. Contribution
Stockwell transform uniquely combines progressive resolution with absolutely referenced phase information which distinguishes it from other time-frequency transforms [16]. In this paper, we use Stockwell transform to map EEG epochs into time-frequency domain and obtain complex-valued matrix. We partition frequency line into 11 segments, in this way 11 matrices are obtained. We extract the entropies of matrices and consider them as features. To this end, we use different entropies and compare their performance. Finally, SVM classifier is used to classify the features into one of the 2-6 stages for single and two channels of EEG signal. The experimental results show that our method outperforms the recently introduced methods.
The rest of the paper is organized as follows. Section II describes the EEG database used in this research. Section III introduces the proposed method for sleep stages classification. Section IV presents the experimental results and performance comparison. Finally, Section V concludes the paper.
II. EXPERIMENTAL DATA
The data used in this study were obtained from the sleep-EDF database [17] which is publically available at http://physionet.org. It contains EEG recordings of eight Caucasian male and females (21-35 years old) without any kind of medication. This database includes two EEG channels, namely, Fpz-Cz and Pz-Oz and one horizontal electrooculogram (EOG) channel where their sampling frequency is 100 Hz. The data is divided into two parts: sc* and st*, each having four subjects [18]. The four sc* recordings were acquired in 1989 from ambulatory healthy volunteers during 24 hours in their regular life. The four st* recordings were acquired in 1994 from subjects who had minor difficulty in falling asleep but were otherwise healthy, during a night in the hospital [17, 18].
In this study we use Pz-Oz and Fpz-Cz channels. EEG recordings were scored in sleep stages according to the R&K rule to obtain the hypnograms. The duration of each epoch is 30 seconds, therefore, the number of points for each epoch noting 100 Hz sampling frequency is 30×100 = 3000. Epochs were labeled as S1, S2, S3, S4, AWA, REM, MVT (movement time), or UNS (Unscored). The number of epochs for each label is presented in Table I.
TABLE I
Number of Epochs in Different Sleep Stages
| Sleep stage | AWA | S1 | S2 | S3 | S4 | REM | Total |
| Epochs | 8055 | 604 | 3621 | 672 | 627 | 1609 | 15188 |
III. PROPOSED METHOD
Fig. 1 shows the block diagram of proposed sleep stages classification method. As observed, at first each 30-second epoch of EEG signal (3000 points) is mapped into time-frequency domains, using the Stockwell transform. Stockwell transform decomposes a given epoch into a complex time–frequency matrix whose rows and columns correspond to frequency and time, respectively. This matrix contains important information such as amplitude, phase, and frequency [17]. By segmentation of frequency range, 11 new matrices are obtained. In the feature extraction step, the entropies of matrices are computed. The extracted features are then given to SVM classifier to classify each epoch into one of the 2-6 sleep stages based on the number of considered classes. In the following, each part is explained in detail.
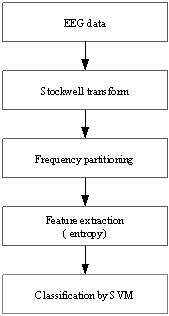
Fig. 1. Block diagram of the proposed method
A. Stockwell transform
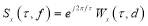
Short-time Fourier transform (STFT) and wavelet transform (WT) were conventionally used for analysis of EEG signals. Stockwell transform, which is the development of continuous WT (CWT) and STFT, is a technique for the analysis of non-stationary signals [19, 20]. It can be defined as a CWT with a specific mother wavelet multiplied by a phase factor, because CWT needs phase correction. The Stockwell transform of a signal x(t) is defined as:
 (1)
(1)
where  and
and
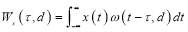 (2)
(2)
is the wavelet transform of a function x(t) with the mother wavelet  given by:
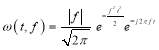 (3)
(3)
where the frequency f is the inverse of d (f = 1/d). Therefore, the Stockwell transform of signal x(t) can be calculated as:
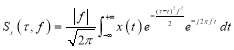 (4)
(4)
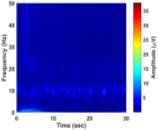
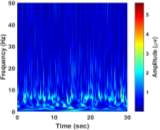
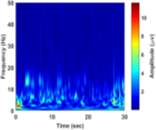
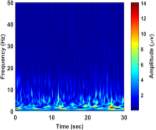
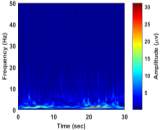
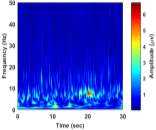
From (3), it is observed that the window length is variable. When f increases, the length of the window decreases. The advantage of Stockwell transform over the STFT is that the window width is a function of f rather than a fixed one as in STFT [21]. The Gaussian window is wider at lower frequencies and narrower at higher frequencies. Hence, the window provides good frequency resolutions for low frequencies while providing good time resolutions for high frequency. The amplitudes of Stockwell transform of one epoch from each sleep stage are shown in Fig. 2.
 |
 |
|
| a) Stage Awa | b) Stage S1 | |
 |
 |
|
| c) Stage S2 | d) Stage S3 | |
 |
 |
|
| e) Stage S4 | f) Stage NREM | |
|
||
B. Feature extraction
In this part, we explain the proposed feature extraction method.
B.1. Time-frequency partitioning
Time range of EEG epoch is (0 30) sec which equals points (0 3000). We notice that since the sampling frequency of Sleep-EDF database is 100 Hz, the maximum frequency is 50 Hz. We divide the frequency range of Stockwell transform output into 11 different sub-bands as: (0.4 4) Hz, (4 8) Hz, (8 10) Hz, (10 13) Hz, (13 18) Hz, (18 25) Hz, (25 30) Hz, (30 36) Hz, (36 41) Hz, (41 46) Hz, and (46 50) Hz. In this way, 11 new matrices are obtained. Fig. 3 demonstrates these matrices (denoted by TF) and their corresponding dimensions. The frequency range (0 0.4) Hz is considered as base-line noise. It should be mentioned that these sub-bands were obtained through extensive experiments.
|
50 41 36 30 Frequency (Hz) 25 18 13 4 0.4
30 0 Time (sec) |
|||||||||||
| Fig. 3. Frequency partitioning of Stockwell transform output |


B.2. Calculation of entropies
Entropy was first used in the communications, then it proceeded to other areas such as image and signal processing [23, 24]. Here, we consider four different entropies, including log-energy, non-normalized log-energy, Shannon, and non-normalized Shannon. We obtain entropy for each time-frequency matrix shown in Fig. 3. To calculate the entropy, each matrix is converted into a vector. Let the vector  contain the values of a size
  matrix. The vector
  is defined as follows:
 (5)
(5)
Log-energy entropy of the vector V is calculated as [25]:
 (6)
(6)
Shannon entropy is calculated as [25]:
 (7)
(7)
Now, suppose the vector  , where si is the absolute value of the ith element of the vector Vinstead of the probability density function in classical entropy representation. Its log energy entropy, named non-normalized log-energy is defined as [24]:
 (8)
(8)
Similarly, non-normalized Shannon (Shannon energy) entropy is calculated as [26]:
 (9)
(9)
In section IV, we evaluate the performance of each entropy.
C. Classification
SVM classifies the input feature vector according to a scheme based on statistical learning theory in an effort to minimize the error and maximizes the class separation interval [27]. SVM maps the input vector into a high-dimensional linear feature space through a non-linear mapping, and then constructs an optimal separating hyper plane between the classes. SVM increases the dimensionality of the problem until it can find a hyper plane separation between the classes in the feature space [28, 29]. In this paper we apply SVM classifier with Gaussian kernel.
IV. EXPERIMENTAL RESULTS
In this section, we assess the performance of the proposed method. To this end, the performances of four different entropies are compared and the one that gives better results, is considered for further evaluations. It should be noted that in the experiments we use the Pz-Oz and Fpz-Cz channels and evaluate the proposed method on each channel separately. We also combine the features of the two channels and obtain the performance. The performance of the proposed method is compared with other methods reported in the literature.
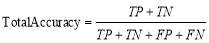
In this research, the performance measures are classification accuracy, sensitivity, confusion matrix, and Kappa coefficient. Classification accuracy is defined as [18]:
 (10)
(10)
where TP (true positive) is the number of epochs that are classified correctly for each stage and TN (true negative) is defined as the number of epochs that do not belong to the considered stage and the classifier does not classify them to that stage. FN (false negative) is the number of epochs that are classified incorrectly for each stage. Also, FP (false positive) is the number of epochs of other stages wrongly classified to the considered stage [30].
A confusion matrix contains information about the actual and predicted classifications done by a classification system. Sensitivity or true positive rate is a measure of ability of a prediction model to select instances of a certain class from a dataset. It corresponds to the true positive rate obtained as [27]:
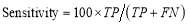 (11)
(11)
Kappa coefficient is the measurement of performance agreement between the proposed method and the expert classification [31]. It is defined as:
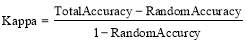 (12)
(12)
where
 (13)
(13)
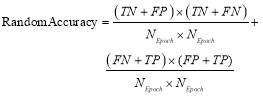 (14)
(14)
where  denotes the total number of used epochs.
The results were obtained by ten-fold cross-validation, in which the data set is partitioned into 10 equal-size subsets. In each iteration, one subset is considered as test data, while the other nine subsets are used for training. The whole procedure is then repeated 10 times using a different testing subset [5]. Also, to consider the effect of randomly chosen of subsets in 10-fold cross-validation, we perform 10-fold cross-validation for 10 times. Then, the average and standard deviation of the obtained results are reported.
A. Comparison of entropies
In subsections III.B and III.C, 11 entropy features were extracted for the 11 matrices obtained from Stockwell transform. Tables II-IV show the performances of four aforementioned entropies evaluated on different channels. The highest classification accuracy rates were highlighted. From the Tables, it is observed that the performance of non-normalized log-energy entropy in all cases is better than the other entropies. For this entropy, the accuracies of Pz-Oz, Fpz-Cz and both channels were obtained as 91.00%, 91.66%, and 93.00%, respectively in six sleep stages classification. Therefore, in the rest of the paper, the results are presented for non-normalized log-energy. It is seen that the performance of both channels is better than one channel.
TABLE II
Accuracy (%) Comparison of Four Different Entropies on Pz-Oz Channel
| Entropy | Number of features | Number of sleep stages | ||||
| 6-Class | 5-Class | 4-Class | 3-Class | 2-Class | ||
| Non-normalized log-energy | 11 | 91.00 ± 0.09 | 92.25 ± 0.04 | 93.31 ± 0.07 | 95.59 ± 0.05 | 98.27 ± 0.01 |
| Log-energy | 11 | 79.47 ± 0.05 | 80.30 ± 0.07 | 81.21 ± 0.07 | 87.13 ± 0.09 | 91.23 ± 0.03 |
| Non-normalized Shannon | 11 | 79.52 ± 0.10 | 80.92 ± 0.07 | 82.00 ± 0.07 | 84.46 ± 0.07 | 90.15 ± 0.08 |
| Shannon | 11 | 77.61 ± 0.08 | 78.33 ± 0.05 | 79.45 ± 0.07 | 85.14 ± 0.04 | 89.38 ± 0.04 |
TABLE III
Accuracy (%) Comparison of Four Different Entropies on Fpz-Cz Channel
| Entropy | Number of features | Number of sleep stages | ||||
| 6-Class | 5-Class | 4-Class | 3-Class | 2-Class | ||
| Non-normalized log-energy | 11 | 91.66 ± 0.06 | 92.67 ± 0.04 | 93.56 ± 0.05 | 95.57 ± 0.04 | 98.35 ± 0.04 |
| Log-energy | 11 | 80.51 ± 0.05 | 81.69 ± 0.05 | 82.87 ± 0.04 | 88.96 ± 0.05 | 93.12 ± 0.06 |
| Non-normalized Shannon | 11 | 80.99 ± 0.06 | 82.15 ± 0.07 | 83.43 ± 0.08 | 85.70 ± 0.06 | 90.00 ± 0.05 |
| Shannon | 11 | 76.73 ± 0.07 | 77.75 ± 0.06 | 78.88 ± 0.05 | 84.97 ± 0.08 | 89.45 ± 0.07 |
TABLE IV
Accuracy (%) comparison of four different entropies on Pz-Oz & Fpz-Cz Channels
| Entropy | Number of features | Number of sleep stages | ||||
| 6-Class | 5-Class | 4-Class | 3-Class | 2-Class | ||
| Non-normalized log-energy | 11+11 | 93.00 ± 0.05 | 93.99 ± 0.06 | 94.95 ± 0.04 | 96.96 ± 0.04 | 99.10 ± 0.02 |
| Log-energy | 11+11 | 83.95 ± 0.06 | 85.20 ± 0.07 | 86.50 ± 0.08 | 91.57 ± 0.06 | 95.33 ± 0.06 |
| Non-normalized Shannon | 11+11 | 86.30 ± 0.08 | 87.48 ± 0.05 | 88.30 ± 0.07 | 90.81 ± 0.04 | 95.04 ± 0.03 |
| Shannon | 11+11 | 79.35 ± 0.05 | 80.26 ± 0.09 | 81.90 ± 0.09 | 87.58 ± 0.09 | 90.22 ± 0.04 |
In Table V we have shown the performance of the proposed method for 2-6 stages classification in term of Kappa coefficient for non-normalized log-energy entropy features. It can be noticed that the performance of Fpz-Cz channel for 2, 4, 5, and 6 sleep stages classification is slightly better than the Pz-Oz.
B. Confusion matrix
Tables VI-X illustrate the confusion matrix for different sleep stages when both channels are used. We also obtained the sensitivity for different classes. The results demonstrate the effectiveness of the proposed method in classification of sleep stages.
TABLE V
Comparison of Kappa Coefficients of EEG Channels with log-Energy Entropy Features
| Channel | 6-Class | 5-Class | 4-Class | 3-Class | 2-Class |
| Fpz-Cz | 0.8694 | 0.8847 | 0.8960 | 0.9228 | 0.9669 |
| Pz-Oz | 0.8585 | 0.8776 | 0.8918 | 0.9231 | 0.9652 |
| Fpz-Oz & Pz-Oz | 0.8905 | 0.9054 | 0.9184 | 0.9470 | 0.9818 |
TABLE VI
Confusion Matrix (%) and Sensitivity (%) for Six Sleep Stages Classification on Both Channels
| Predicted class | Sensitivity (%) | |||||||
| AWA | S1 | S2 | S3 | S4 | REM | |||
|
Actual class |
AWA | 99.58 | 0.22 | 0.11 | 0 | 0 | 0.07 | 99.58 |
| S1 | 15.33 | 54.55 | 16.47 | 0.03 | 0 | 13.60 | 54.55 | |
| S2 | 0.70 | 0.88 | 94.31 | 2.38 | 0 | 1.71 | 94.31 | |
| S3 | 0.65 | 0.02 | 26.84 | 64.77 | 7.69 | 0 | 64.77 | |
| S4 | 0.38 | 0 | 3.79 | 14.78 | 81.03 | 0 | 81.03 | |
| REM | 1.28 | 3.34 | 7.37 | 0 | 0 | 87.99 | 87.99 | |
TABLE VII
Confusion Matrix (%) and Sensitivity (%) for Five Sleep Stages Classification on Both Channels
| Predicted class | Sensitivity (%) | ||||||
| AWA | S1 | S2 | {S3, S4} | REM | |||
|
Actual class |
AWA | 99.57 | 0.24 | 0.10 | 0 | 0.07 | 99.57 |
| S1 | 15.11 | 54.76 | 16.14 | 0.03 | 13.94 | 54.76 | |
| S2 | 0.71 | 0.87 | 94.10 | 2.57 | 1.73 | 94.10 | |
| {S3, S4} | 0.97 | 0.02 | 14.56 | 84.44 | 0 | 84.44 | |
| REM | 1.24 | 3.29 | 7.29 | 0 | 88.16 | 88.16 | |
TABLE VIII
Confusion Matrix (%) and Sensitivity (%) for Four Sleep Stages Classification on Both Channels
| Predicted class | Sensitivity (%) | |||||
| AWA | {S1, S2} | {S3, S4} | REM | |||
|
Actual class |
AWA | 99.29 | 0.62 | 0 | 0.07 | 99.29 |
| {S1, S2} | 1.93 | 93.23 | 2.08 | 2.75 | 93.23 | |
| {S3, S4} | 0.30 | 15.63 | 84.06 | 0 | 84.06 | |
| REM | 0.74 | 12.78 | 0 | 86.46 | 86.46 | |
TABLE IX
Confusion Matrix (%) and Sensitivity (%) for Three Sleep Stages Classification on Both Channels
| Predicted class | Sensitivity (%) | ||||
| AWA | NREM | REM | |||
|
Actual class |
AWA | 99.20 | 0.70 | 0.08 | 99.20 |
| NREM | 1.31 | 96.41 | 2.27 | 96.41 | |
| REM | 0.59 | 11.80 | 87.59 | 87.59 | |
TABLE X
Confusion matrix (%) and Sensitivity (%) for Two Sleep Stages Classification on Both Channels
| Predicted class | Sensitivity (%) | |||
| AWA | Sleep | |||
|
Actual class |
AWA | 99.14 | 0.85 | 99.14 |
| Sleep | 0.95 | 99.04 | 99.04 | |
C. Performance comparison
In Table XI, the classification accuracy of the proposed method is compared with those of other methods for Fpz-Cz, Pz-Oz, and both channels. Moreover, Table XII compares the performances of the proposed method and other methods for Pz-Oz channel in term of Kappa coefficient. The highest classification accuracies were highlighted. All results were obtained for sleep-EDF database. It is observed that, the performance of the proposed method is better than the other methods.
Zhu et al. [3] identified sleep stages using DVG. They used 14963 segments of the Pz-Oz channel. Their accuracy results were 87.5%, 88.9%, 89.3%, 92.6% and 97.9% for six stages to two stages classification of sleep, respectively. In all stages their accuracy rates were lower than our results. Hassan et al. [9, 10, 15] in three separate studies used Pz-Oz and Fpz-Cz channels. In their first work [9], statistical moments and bagged decision trees were used to classify sleep stages for Pz-Oz channel. They reported 86.8%, 90.6%, 92.1%, 94.1% and 99.4% accuracy for six to two stages classification, respectively. In four cases (6, 5, 4, and 3 stages), our proposed method has better performance than their method. In the second study [10], statistical features were extracted from Pz-Oz channel and AdaBoost classifier was used for six to two stages classification. In all stages, their performances are lower than ours. In the third research [15], Fpz-Cz and Pz-Oz channels were used for 2-6 stages classification based on the random forest classifier. In their study, the accuracy of Fpz-Cz channel is lower than the Pz-Oz channel. The accuracy rates in all cases for Fpz-Cz and Pz-Oz channels were also lower than those of the proposed method. Doroshenkov et al. [32] used two channels of EEG based on hidden Markov model. Their work yielded 61% accuracy for six sleep stages while the proposed method achieves 93% accuracy for the same conditions; moreover, the number of epochs (1200 epochs) in their work is less than ours (15188 epochs). Liang et al. [8] used 3708 segments of Pz-Oz channel for five sleep stages classification. They obtained 83.6% accuracy, which is lower than that of the proposed method. Hsu et al. [33] reported 87.2% success rate for five sleep stages classification. They used 2880 segments of Fpz-Cz channel; however, the accuracy of the proposed method is 92.6% for five sleep stages in the Fpz-Cz channel with 15188 segments.
V. CONCLUSION
In this study, we proposed new features for sleep stages classification from EEG signal based on Stockwell transform. At first the output matrix of Stockwell transform of EEG data was divided into 11 matrices. Then, one entropy was extracted from each matrix. Therefore, for each channel 11 features were obtained. We considered four different entropies, i.e., log-energy, Shannon, non-normalized log-energy and non-normalized Shannon. It was shown that the performance of non-normalized log-energy is higher than others. 10-fold cross-validation of six sleep stages classification resulted in accuracy of 91.00%, 91.66%, and 93.00% respectively for Pz-Oz, Fpz-Cz, and both channels by SVM classifier. The proposed method had better performance than the others in terms of accuracy, Kappa coefficient, and confusion matrix.
TABLE XI
Classification Accuracy (%) Comparison of Various Methods for Sleep-EDF Database
| Authors and methods | Channel and number of segments | Number of sleep stages | ||||
| 6-Class | 5-Class | 4-Class | 3-Class | 2-Class | ||
| Zho et al. [3]
(Difference visibility graph, SVM) |
Pz-Oz (14963) | 87.5 | 88.9 | 89.3 | 92.6 | 97.9 |
| Hassan et al. [10]
(Statistical features and AdaBoost) |
Pz-Oz (15188) | 88.6 | 90.1 | 91.2 | 93.5 | 97.7 |
| Hassan et al. [9]
(Statistical moments and Bagging) |
Pz-Oz (15188) | 86.8 | 90.6 | 92.1 | 94.1 | 99.4 |
| Liang et al. [8]
(Multi scale Entropy and LDA) |
Pz-Oz (3708) | – | 83.6 | – | – | – |
| Hsu et al. [33]
(Energy feature and Elman neural network) |
Fpz-Cz (2880) | – | 87.2 | – | – | – |
| Doroshenkov et al. [32]
(Hidden Markov model) |
Both (1200) | 61.08 | – | – | – | – |
| Hassan et al. [15]
(Wavelet transform, Random forest) |
Pz-Oz (15188) | 90.3 | 91.5 | 92.1 | 94.8 | 97.5 |
| Fpz-Cz (15188) | 87.1 | 88.5 | 90.60 | 92.3 | 96.5 | |
| Proposed method
(Stockwell transform, time-frequency partitioning, entropy features, SVM) |
Fpz-Cz (15188) | 91.66 | 92.67 | 93.56 | 95.57 | 98.35 |
| Pz-Oz (15188) | 91.00 | 92.25 | 93.31 | 95.59 | 98.27 | |
| Both (15188) | 93.00 | 93.99 | 94.95 | 96.96 | 99.10 | |
TABLE XII
KAPPA Coefficients of Various Methods for Pz-Oz Channel of Sleep-EDF Data-Set
| Authors | Number of sleep stages | ||||
| 6-Class | 5-Class | 4-Class | 3-Class | 2-Class | |
| Zhu et al. [3] | 0.81 | 0.83 | 0.83 | 0.87 | 0.96 |
| Hassan et al. [15] | 0.8435 | 0.8617 | 0.8686 | 0.9073 | 0.95 |
| Liang et al. [8] | – | 0.7452 | – | – | – |
| Proposed method | 0.8585 | 0.8776 | 0.8918 | 0.9231 | 0.9652 |
REFERENCES
[1] Y. Li, “Multichannel EEG signal classification-A geometric approach,” Ph.D. dissertation, McMaster Univ., Hamilton, ON, Canada, 2010.
[2] A. Rechtschaffen and A. Kales, “A manual of standardized terminology, techniques and scoring system for sleep stages of human subjects,” publication (NIH) 204. Bethesda, Md, Neurological Information
Network, 1968.
[3] G. Zhu, Y. Li, and P. P. Wen, “Analysis and classification of sleep stages based on difference visibility graphs from a single-channel EEG signal,” IEEE journal of biomedical and health informatics, vol. 18, no. 6, pp. 1813-1821, 2014.
[4] R. G. Baraniuk, “Warped perspectives in time-frequency analysis,” in Time-Frequency and Time-Scale Analysis, 1994., Proceedings of the IEEE-SP International Symposium on, 1994, pp. 528-531: IEEE.
[5] A. Feltane, “Time-Frequency Based Methods for Non-Stationary Signal Analysis with Application To EEG Signals,” Ph.D. dissertation,University of Rhode Island, 2016.
[6] F. Miwakeichi, E. Martınez-Montes, P. A. Valdés-Sosa, N. Nishiyama, H. Mizuhara, and Y. Yamaguchi, “Decomposing EEG data into space–time–frequency components using parallel factor analysis,” NeuroImage, vol. 22, no. 3, pp. 1035-1045, 2004.
[7] B. J. Roach and D. H. Mathalon, “Event-related EEG time-frequency analysis: an overview of measures and an analysis of early gamma band phase locking in schizophrenia,” Schizophrenia bulletin, vol. 34, no. 5, pp. 907-926, 2008.
[8] S.-F. Liang, C.-E. Kuo, Y.-H. Hu, Y.-H. Pan, and Y.-H. Wang, “Automatic stage scoring of single-channel sleep EEG by using multiscale entropy and autoregressive models,” IEEE Transactions on Instrumentation and Measurement, vol. 61, no. 6, pp. 1649-1657, 2012.
[9] A. R. Hassan and M. I. H. Bhuiyan, “Computer-aided sleep staging using complete ensemble empirical mode decomposition with adaptive noise and bootstrap aggregating,” Biomedical Signal Processing and Control, vol. 24, pp. 1-10, 2016.
[10] A. R. Hassan and M. I. H. Bhuiyan, “Automatic sleep scoring using statistical features in the EMD domain and ensemble methods,” Biocybernetics and Biomedical Engineering, vol. 36, no. 1, pp. 248-255, 2016.
[11] S. Güneş, K. Polat, and Ş. Yosunkaya, “Efficient sleep stage recognition system based on EEG signal using k-means clustering based feature weighting,” Expert Systems with Applications, vol. 37, no. 12, pp. 7922-7928, 2010.
[12] K. A. Aboalayon, H. T. Ocbagabir, and M. Faezipour, “Efficient sleep stage classification based on EEG signals,” in Systems, Applications and Technology Conference (LISAT), 2014 IEEE Long Island, 2014, pp. 1-6: IEEE.
[13] H.-t. Wu, R. Talmon, and Y.-L. Lo, “Assess sleep stage by modern signal processing techniques,” IEEE Transactions on Biomedical Engineering, vol. 62, no. 4, pp. 1159-1168, 2015.
[14] M. Peker, “A new approach for automatic sleep scoring: Combining Taguchi based complex-valued neural network and complex wavelet transform,” Computer methods and programs in biomedicine, vol. 129, pp. 203-216, 2016.
[15] A. R. Hassan and M. I. H. Bhuiyan, “A decision support system for automatic sleep staging from EEG signals using tunable q-factor wavelet transform and spectral features,” Journal of neuroscience methods, vol. 271, pp. 107-118, 2016.
[16] R. G. Stockwell, “A basis for efficient representation of the S-transform,” Digital Signal Processing, vol. 17, no. 1, pp. 371-393, 2007.
[17] B. Kemp, “The sleep-edf database online,” URL http://www. physionet. org/physiobank/database/sleep-edf, 2013.
[18] K. Rai, V. Bajaj, and A. Kumar, “Hilbert-Huang transform based classification of sleep and wake EEG signals using fuzzy c-means algorithm,” in Communications and Signal Processing (ICCSP), 2015 International Conference on, 2015, pp. 0460-0464: IEEE.
[19] R. G. Stockwell, L. Mansinha, and R. Lowe, “Localization of the complex spectrum: the S transform,” IEEE transactions on signal processing, vol. 44, no. 4, pp. 998-1001, 1996.
[20] Y. Xia, W. Zhou, C. Li, Q. Yuan, and S. Geng, “Seizure detection approach using S-transform and singular value decomposition,” Epilepsy & Behavior, vol. 52, pp. 187-193, 2015.
[21] G. Rutkowski, K. Patan, and P. Leśniak, “Computer-aided on-line seizure detection using stockwell transform,” in Intelligent Systems in Technical and Medical Diagnostics: Springer, 2014, pp. 279-289.
[22] A. Yan et al., “Automatic seizure detection using Stockwell transform and boosting algorithm for long-term EEG,” Epilepsy & Behavior, vol. 45, pp. 8-14, 2015.
[23] C. Cenker, M. Mayer, and G. Pflug, “Entropy functions for wavelet packet classification and feature extraction1.”
[24] J.-S. Zhang and C.-J. Chen, “Local variance projection log energy entropy features for illumination robust face recognition,” in Biometrics and Security Technologies, 2008. ISBAST 2008. International Symposium on, 2008, pp. 1-5: IEEE.
[25] T. Li and M. Zhou, “ECG Classification Using Wavelet Packet Entropy and Random Forests,” Entropy, vol. 18, no. 8, p. 285, 2016.
[26] D. Wang, D. Miao, and C. Xie, “Best basis-based wavelet packet entropy feature extraction and hierarchical EEG classification for epileptic detection,” Expert Systems with Applications, vol. 38, no. 11, pp. 14314-14320, 2011.
[27] V. Kecman, Learning and soft computing: support vector machines, neural networks, and fuzzy logic models. MIT press, 2001.
[28] E. Fehrmann, “Automated sleep classification using the new sleep stage standards,” 2013.
[29] V. Vapnik, The nature of statistical learning theory. Springer science & business media, 2013.
[30] H. Kalbkhani, M. G. Shayesteh, and B. Zali-Vargahan, “Robust algorithm for brain magnetic resonance image (MRI) classification based on GARCH variances series,” Biomedical Signal Processing and Control, vol. 8, no. 6, pp. 909-919, 2013.
[31] M. Diykh, Y. Li, and P. Wen, “EEG sleep stages classification based on time domain features and structural graph similarity,” IEEE Transactions on Neural Systems and Rehabilitation Engineering, vol. 24, no. 11, pp. 1159-1168, 2016.
[32] L. Doroshenkov, V. Konyshev, and S. Selishchev, “Classification of human sleep stages based on EEG processing using hidden Markov models,” Biomedical Engineering, vol. 41, no. 1, pp. 25-28, 2007.
[33] Y.-L. Hsu, Y.-T. Yang, J.-S. Wang, and C.-Y. Hsu, “Automatic sleep stage recurrent neural classifier using energy features of EEG signals,” Neurocomputing, vol. 104, pp. 105-114, 2013.
Cite This Work
To export a reference to this article please select a referencing stye below:
Related Services
View all


Related Content
All TagsContent relating to: "Neurology"
Neurology is the specialist branch of medicine that deals with the treatment of disorders of the nervous system. This means that neurologists concern themselves with issues affecting the brain, the nerves, and the spinal cord.
Related Articles

DMCA / Removal Request
If you are the original writer of this dissertation and no longer wish to have your work published on the UKDiss.com website then please: